8 - Logging & Post-Processing
GEMS offers a variety of options to collect data during simulation runs and process them to obtain aggregated statistics. This tutorial teaches you how to access the data and customize how data is being collected and processed.
Internal Loggers
Accessing a simulation's internal loggers is easy. They can be accessed via infectionlogger(sim), deathlogger(sim), healthlogger(sim), testlogger(sim), pooltestlogger(sim), quarantinelogger(sim), or customlogger(sim). Here's the data that is being logged for all infections:
using GEMS
sim = Simulation()
run!(sim)
inf_logger = infectionlogger(sim)
dataframe(inf_logger)
Output
[ Info: 23:40:26 | Initializing Simulation [Simulation 79] with default configuration
[ Info: 23:40:26 | └ Creating population
[ Info: 23:40:28 | └ Creating simulation object
[ Info: 23:40:29 | Running Simulation Simulation 79
100.0%┣████████████████████████████████████████┫ 365 days/365 days [00:29<00:00, 13 days/s]
74078×23 DataFrame
   Row │ infection_id  tick   id_a   id_b   progression_category  infectiousness_onset ⋯
       │ Int32         Int16  Int32  Int32  Symbol                Int16                ⋯
───────┼────────────────────────────────────────────────────────────────────────────────
     1 │            1      0     -1  81435  Critical                                 1 ⋯
     2 │            2      0     -1  37134  Asymptomatic                             2
   ⋮   │      ⋮          ⋮      ⋮      ⋮             ⋮                     ⋮           ⋱
 74077 │        74077    183  20556  41661  Severe                                184
 74078 │        74078    190  81857  73144  Mild                                   191
17 columns and 74031 rows omitted Put a ? into the Julia REPL and call help?> dataframe(::InfectionLogger) to get an overview of the columns that are available in the InfectionLogger's dataframe. Replace the argument ::InfectionLogger with any of the other logger types to see their descriptions or look up the Logger section in the API documentation.
The PostProcessor
The PostProcessor is the binding element between the raw data coming from the simulation's internal loggers and the ResultData object. It is instantiated with the Simulation object and performs some initial operations and joins on the raw data, and stores the results in internal dataframes (infectionsDF, populationDF, deathsDF, testsDF, pooltestsDF, quarantinesDF). An exception is the sim_infectionsDF-dataframe which only contains infections that happened during the simulation, excluding all initial, seeding infections. This example shows how the PostProcessor's internal infections-dataframe is already joined with data from the population-dataframe:
using GEMS
sim = Simulation()
run!(sim)
pp = PostProcessor(sim)

infectionsDF(pp)
Output
[ Info: 23:41:39 | Initializing Simulation [Simulation 80] with default configuration
[ Info: 23:41:39 | └ Creating population
[ Info: 23:41:40 | └ Creating simulation object
[ Info: 23:41:41 | Running Simulation Simulation 80
100.0%┣█████████████████████████████████████████┫ 365 days/365 days [00:57<00:00, 6 days/s]
74549×52 DataFrame
   Row │ infection_id  tick   id_a   id_b    progression_category  infectiousness_onse ⋯
       │ Int32         Int16  Int32  Int32   Symbol                Int16               ⋯
───────┼────────────────────────────────────────────────────────────────────────────────
     1 │        37305     55  99752       1  Mild                                    5 ⋯
     2 │        68257     81  57862       2  Severe                                  8
   ⋮   │      ⋮          ⋮      ⋮      ⋮              ⋮                     ⋮          ⋱
 74548 │        20815     45  38327   99999  Mild                                    4
 74549 │        74126    113  16508  100000  Severe                                11
                                                       47 columns and 74502 rows omitted
You might have noticed, that this dataframe contains characteristics about the infecting and infected individuals (e.g., age or sex) or whether they were detected. It is now much easier to use this data to calculate more sophisticated statistics such as an age-age contact matrix for infections. Many processing functions are already available. Here's how you can calculate the effective reproduction rate per time unit using the PostProcessor:
using GEMS
sim = Simulation()
run!(sim)
pp = PostProcessor(sim)

effectiveR(pp)
Output
[ Info: 23:43:16 | Initializing Simulation [Simulation 81] with default configuration
[ Info: 23:43:16 | └ Creating population
[ Info: 23:43:18 | └ Creating simulation object
[ Info: 23:43:19 | Running Simulation Simulation 81
100.0%┣█████████████████████████████████████████┫ 365 days/365 days [01:25<00:00, 4 days/s]
365×7 DataFrame
 Row │ tick   effective_R  in_hh_effective_R  out_hh_effective_R  rolling_R   ⋯
     │ Int64  Float64      Float64            Float64             Float64     ⋯
─────┼──────────────────────────────────────────────────────────────────────────
   1 │     1      2.21429           0.571429            1.64286     2.21429   ⋯
   2 │     2      1.45833           0.541667            0.916667    1.83631   ⋯
  ⋮  │   ⋮         ⋮               ⋮                  ⋮               ⋮
 364 │   364      0.0               0.0                 0.0         0.0       ⋯
 365 │   365      0.0               0.0                 0.0         0.0       ⋯
361 rows omittedLook up the Post-Processor section in the API documentation for a full list of available options.
Custom Post-Processing
In some cases, you might want to add custom functionalities to the PostProcessor. The following example add a new post-processor function that calculates the number of infections where a older person infected a younger person:
using GEMS, DataFrames

function old_infects_young(pp::PostProcessor)
    infs = sim_infectionsDF(pp) # load the simulated infections
    filtered = infs[infs.age_a .> infs.age_b, :] # filter for Age A > Age B
    grouped = groupby(filtered, :tick) # group by simulation time (tick)
    res = combine(grouped, nrow => :count) # combine count
    return res
end

sim = Simulation()
run!(sim)
pp = PostProcessor(sim)

old_infects_young(pp)
Output
[ Info: 23:45:19 | Initializing Simulation [Simulation 82] with default configuration
[ Info: 23:45:19 | └ Creating population
[ Info: 23:45:21 | └ Creating simulation object
[ Info: 23:45:22 | Running Simulation Simulation 82
100.0███████████████████████████████████████████┫ 365 days/365 days [00:54<00:00, 7 days/s]
143×2 DataFrame
 Row │ tick   count
     │ Int16  Int64
─────┼──────────────
   1 │     0      3
   2 │     1      7
   ⋮  │   ⋮      ⋮
 142 │   155      1
 143 │   171      1
    139 rows omitted
We advise doing any post-processing via the PostProcessor infrastructure whenever possible, as this will make it very easy to forward you custom results to a custom ResultData object. These things will be explained in the subsequent sections.
The ResultData object
ResultData collects post-processed simulation results for analysis and plotting. It can be created from a Simulation, a PostProcessor, multiple simulations/postprocessors, or a Batch. For example, you can access the cumulative cases directly from the ResultData object like this:
using GEMS
sim = Simulation()
run!(sim)
rd = ResultData(sim)
cumulative_cases(rd)
Output
366×4 DataFrame
 Row │ exposed_cum  infectious_cum  recovered_cum  deaths_cum
     │ Int64        Int64           Int64          Int64
─────┼────────────────────────────────────────────────────────
   1 │         100               0              0           0
   2 │         116              42              0           0
   3 │         137              70              0           0
   4 │         164              97              2           0
   5 │         204             130              6           0
  ⋮  │      ⋮             ⋮               ⋮            ⋮
 363 │       75971           75971          74821        1150
 364 │       75971           75971          74821        1150
 365 │       75971           75971          74821        1150
 366 │       75971           75971          74821        1150
                                              357 rows omitted
You can also explore other results directly, for example by running effectiveR(rd), observed_R(rd) or cumulative_deaths(rd).
Run the info(...) function to get an overview of values that you can retrieve from a ResultData object by calling a function of the same name on the ResultData object:
info(rd)Output
ResultData Entries
└ aggregated_setting_age_contacts
  └ Office
  └ ....
└ meta_data
  └ config_file_val
  └ GEMS_version
  └ ....
└ dataframes
  └ compartment_periods
  └ deaths
  └ ....
└ sim_data
  └ label
  └ initial_infections
  └ number_of_individuals
  └ ....
└ setting_age_contacts
└ system_data
  └ cpu_data
  └ ....
ResultData Styles
By default, ResultData contains all raw and aggregated results.
You can also use the lighter version to keep only aggregated statistics (saves memory, no raw individual-level data):
rd = ResultData(sim; style="LightRD")ResultData Object
└ Dataframes inside: 24
└ Config file: DefaultConf.toml
└ Pathogens: ["Covid19"]
└ Population file: Not available.
└ Individuals: 100000
└ Settings: ["Household", "SchoolClass", "Office"]
└ Simulation:
└ Total infections: 75971
└ Attack rate: 0.75971
└ Total quarantine days: 0
└ Total tests: NamedTuple()
└ Test detection rate: 0.0Custom ResultDataStyles
You can create your own ResultDataStyle to include only the data you need. Each custom style is defined as a struct with a data::Dict{String, Any} field — this is the common structure used in GEMS and ensures consistency with the built-in styles. After creating a ResultData object with your custom style, you can call the usual built-in functions (like label(rd)) directly. For your own new fields, we recommend defining a small function that makes them accessible in the same convenient way.
using GEMS

# 1. Custom post-processing function
function old_infects_young(pp::PostProcessor)
    infs = sim_infectionsDF(pp)
    filtered = infs[infs.age_a .> infs.age_b, :]
    grouped = groupby(filtered, :tick)
    res = combine(grouped, nrow => :count)
    return res
end

# 2. Custom ResultDataStyle using the PostProcessor
mutable struct NewResultDataStyle <: ResultDataStyle
    data::Dict{String, Any}
    # constructor
    NewResultDataStyle(pP::PostProcessor) = new(Dict(
        "sim_data" => Dict(
            "label" => label(simulation(pP)),
        ),
        "dataframes" => Dict(
            "old_infects_young" => old_infects_young(pP)
    )))
end

# 3. Run simulation and postprocessor
sim = Simulation(label = "Test Simulation")
run!(sim)

# 4. Create ResultData with custom style
rd = ResultData(sim; style="NewResultDataStyle")

# 5. Define new functions to access custom data
old_infects_young(rd::ResultData) = rd.data["dataframes"]["old_infects_young"]

# 6. Access custom and built-in fields
label(rd)
Output
"Test Simulation"and
old_infects_young(rd)Output
139×2 DataFrame
 Row │ tick   count
     │ Int16  Int64
─────┼──────────────
   1 │     1      3
   2 │     2     11
   3 │     3     20
   4 │     4     14
   5 │     5     23
  ⋮  │   ⋮      ⋮
 136 │   138      1
 137 │   139      2
 138 │   141      1
 139 │   143      1
    130 rows omitted
Custom Loggers
A lot of data is recorded automatically, i.e., infections or deaths. If you want to collect data during the simulation run that is not available via the default loggers, you can add custom mechanics. The example below tracks how many infected individuals live in households that have 3 or more members. Doing so requires to set up a CustomLogger(...). It takes an arbitrary number of arguments that must be one-argument functions whereas the argument has to be the simulation object. These functions are called once every step when running a simulation.
using GEMS
sim = Simulation()

function logging_func(sim)
    cnt = 0 # counting variable
    inds = individuals(sim)
    for i in inds
        h = household(i, sim)
        if infected(i) && size(h) >= 3
            cnt += 1
        end
    end
    return cnt
end

cl = CustomLogger(infected_in_large_households = logging_func)
customlogger!(sim, cl)

run!(sim)
rd = ResultData(sim)

gemsplot(rd, type = (:TickCases, :CustomLoggerPlot))
Plot
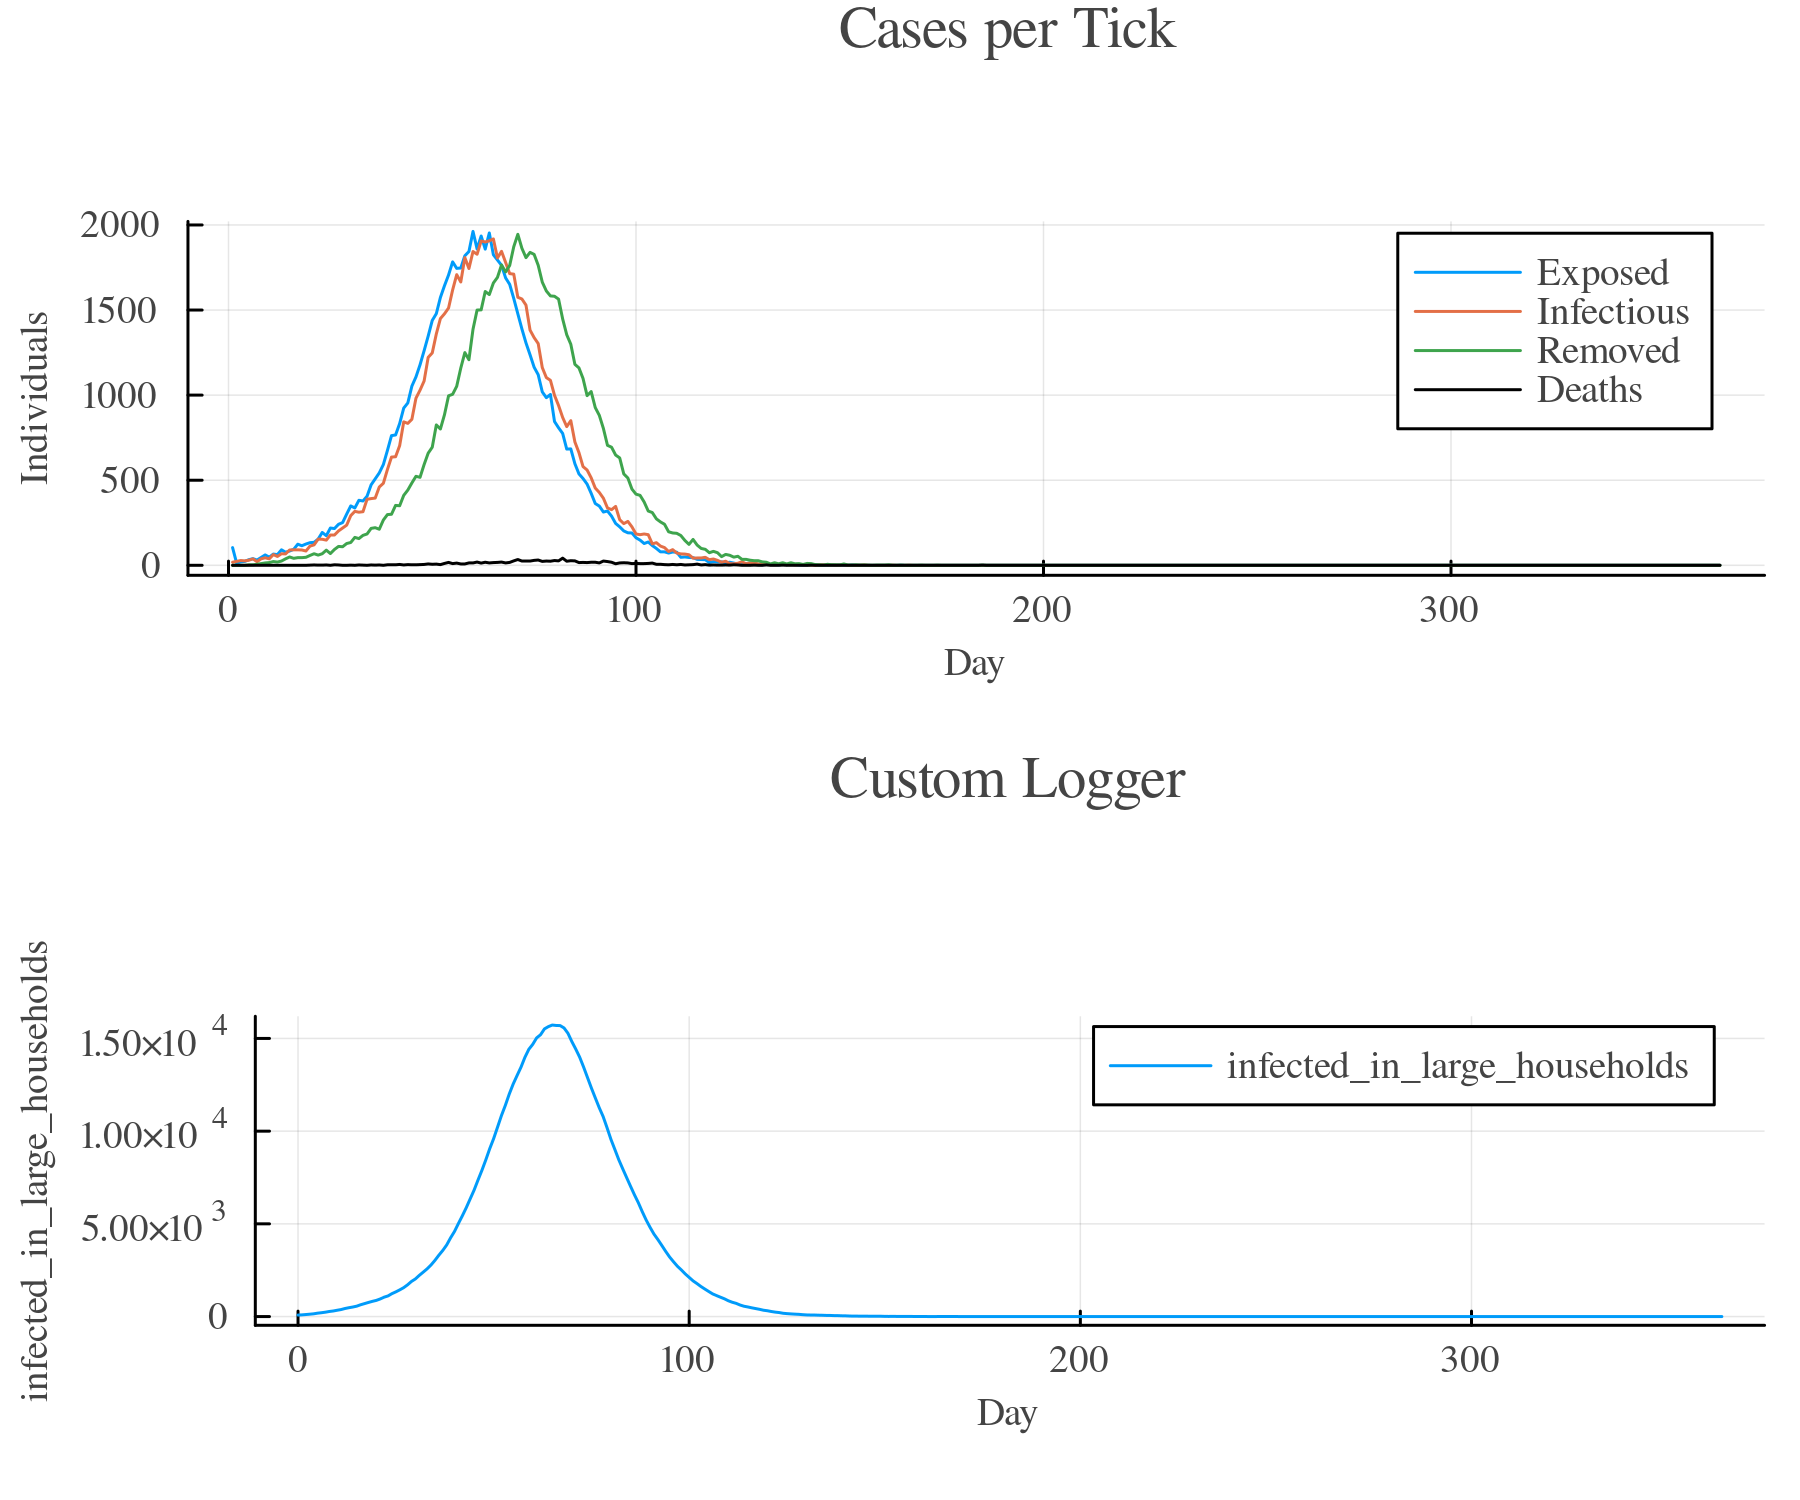
The ResultData object now contains a dataframe that contains the collected data of the custom logger with one column per argument function that was passed to the CustomLogger(...)
customlogger(rd)Output
365×2 DataFrame
 Row │ infected_in_large_households  tick
     │ Any                           Any
─────┼────────────────────────────────────
   1 │ 82                            0
   2 │ 92                            1
  ⋮  │              ⋮                 ⋮
 364 │ 0                             363
 365 │ 0                             364
                          361 rows omitted
You might have noticed, that loggers can severely slow down the simulation runtime if implemented inefficiently as they are executed in every step and potentially require iterations through all individuals every time. Julia provides a number of handy techniques that can speed up calculations significantly. If you feel confident using so-called lambda-functions, you can rewrite the above example to prevent unnecessary memory allocations. The code below does exactly the same as the code above, but takes a fraction of the time.
using GEMS
sim = Simulation()

pred_func(i, sim) = infected(i) && size(household(i, sim)) >= 3

cl = CustomLogger(infected_in_large_households =
    sim -> count(i -> pred_func(i, sim), population(sim)))
customlogger!(sim, cl)

run!(sim)
rd = ResultData(sim)

gemsplot(rd, type = (:TickCases, :CustomLoggerPlot))