9 - Intervention Strategies
GEMS offers extensive options for intervention modeling. We represent interventions using the "Trigger-Strategy-Measure" (TriSM) notation. Find an introduction to the TriSM notation here.
TriSM is more of a modeling paradigm and as such offers countless scenarios that could be modeled. This chapter contains a selection of examples to give you a broad idea. The examples will always compare an intervention scenario with a non-restricted baseline scenario to verify that there is an effect.
Run i_measuretypes() to get a list of all measures that apply to individuals or s_measuretypes() for a list of all measures that apply to settings. If you want to learn more about any of the measure types, put a ? into the Julia REPL and call help?> SelfIsolation (replace SelfIsolation with the measure name you want to learn about).
Self-Isolation With Symptoms
Here's an example that sends individuals into household-isolation for 14 days, if they are symptomatic. To do so, we set up an IStrategy called "self_isolation" and add an instance of the SelfIsolation measure with the duration parameter set to 14.
Scenario Summary:
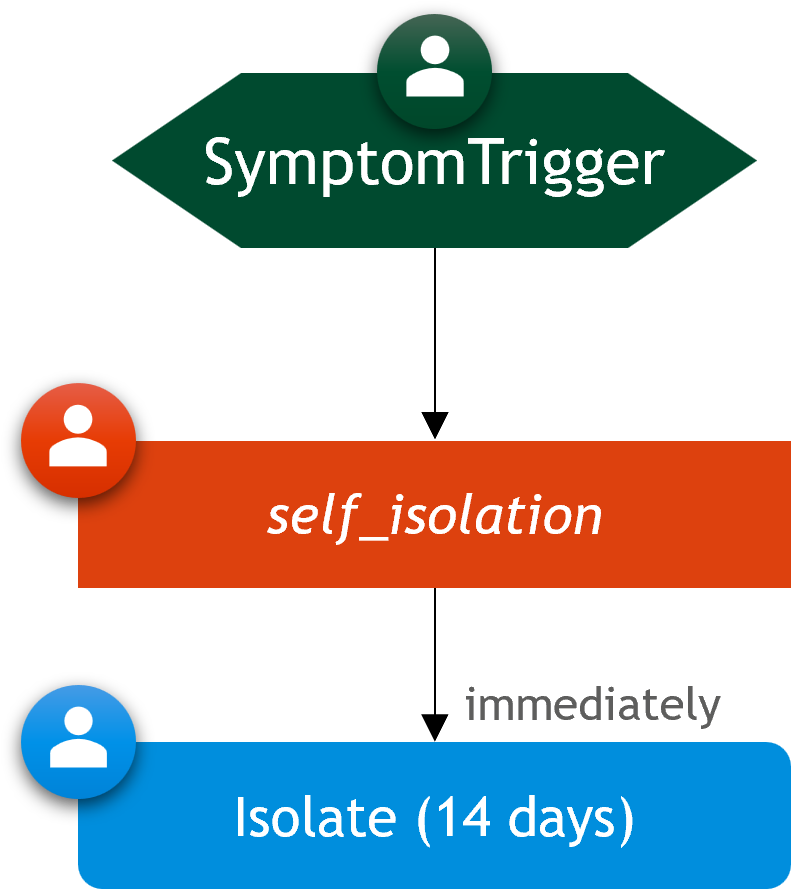
- Individuals go into self-isolation for 14 days, immediately upon experiencing symptoms
- Isolation prevents out-household contacts, but not in-household contacts
- Individuals end their isolation after 14 days, regardless of their infection state
using GEMS
# simulation without interventions
baseline = Simulation(label = "Baseline")

# simulation with 14-day isolation (at home) upon experiencing symptoms
scenario = Simulation(label = "Scenario")
self_isolation = IStrategy("Self Isolation", scenario)
add_measure!(self_isolation, SelfIsolation(14))
trigger = SymptomTrigger(self_isolation)
add_symptom_trigger!(scenario, trigger)

run!(baseline)
run!(scenario)

rd_b = ResultData(baseline)
rd_s = ResultData(scenario)

gemsplot([rd_b, rd_s], type = (:TickCases, :CumulativeDiseaseProgressions, :CumulativeIsolations))
Plot
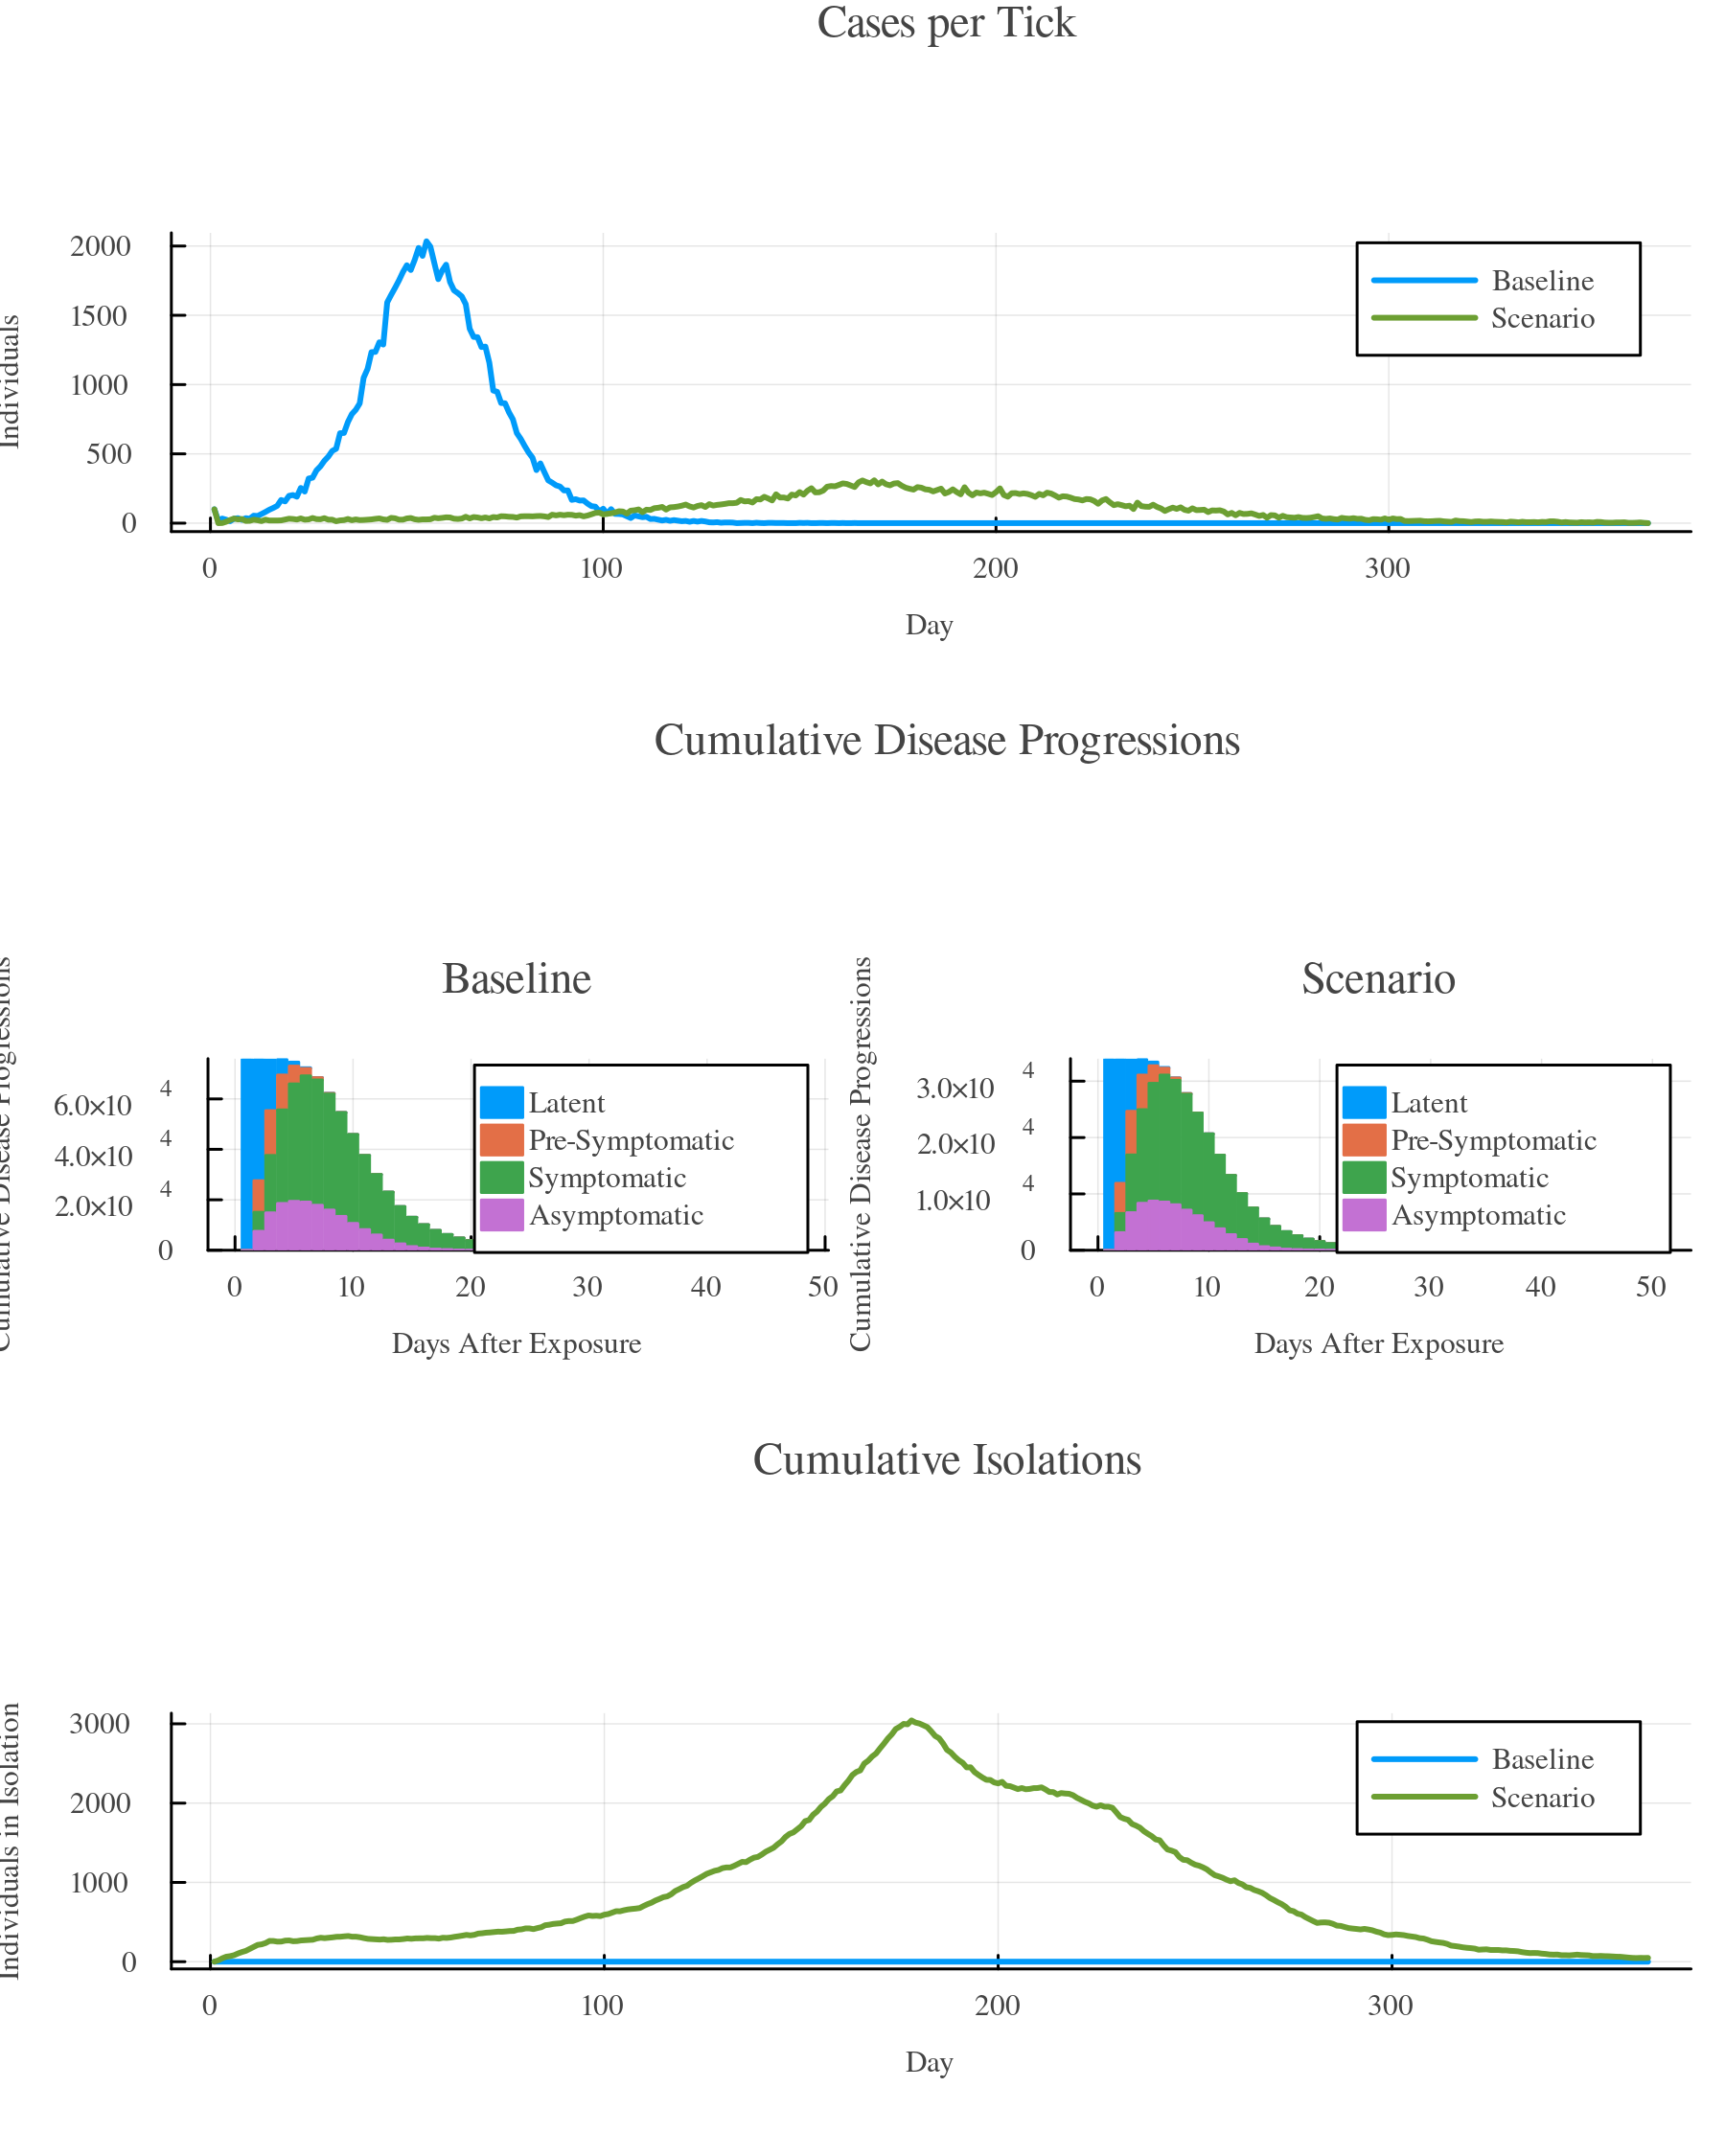
The results show the difference between daily cases in both scenarios. It also displays that there are around one third of asymptomatic cases in both experiments that would not be affected by this measure. Using the :CumulativeIsolations plot, you can inspect the number of people who are currently in isolation at any given time.
Conditioned Measures (Isolation)
The execution of measures and strategies can be conditioned. Here's the self-isolation scenario again but it shall only apply to students. School kids that are symptomatic shall be isolated for 14 days. We can achieve this by passing the optional condition-argument to the add_measure!(...) function. The condition itself must be a one-argument predicate function (a function that returns true or false) that is being evaluated once the measure is being triggered. In the example below, we pass the is_student(individual) function that returns true if an individual is a student.
Scenario Summary:
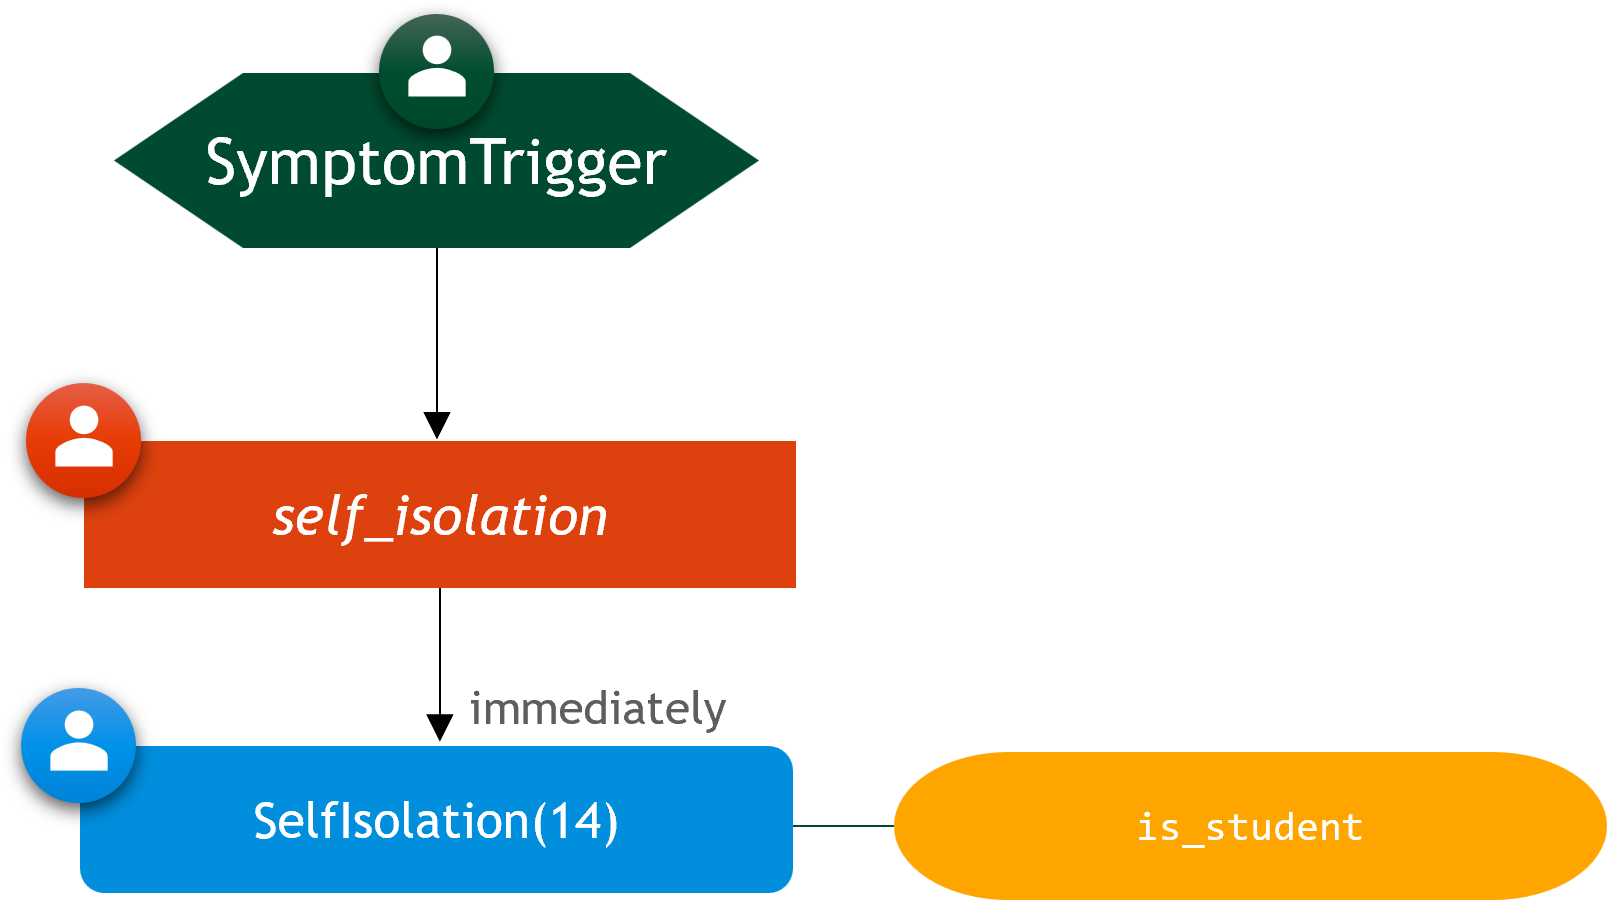
- Students go into self-isolation for 14 days, immediately upon experiencing symptoms
- Isolation prevents out-household contacts, but not in-household contacts
- Students end their isolation after 14 days, regardless of their infection state
using GEMS
# simulation without interventions
baseline = Simulation(label = "Baseline")

# simulation with 14-day isolation (at home)
# upon experiencing symptoms if you are a student
scenario = Simulation(label = "Isolate Students")
self_isolation = IStrategy("Self Isolation", scenario)
add_measure!(self_isolation, SelfIsolation(14), condition = is_student)
trigger = SymptomTrigger(self_isolation)
add_symptom_trigger!(scenario, trigger)

run!(baseline)
run!(scenario)

rd_b = ResultData(baseline)
rd_s = ResultData(scenario)

gemsplot([rd_b, rd_s], type = :TickCases)
Plot
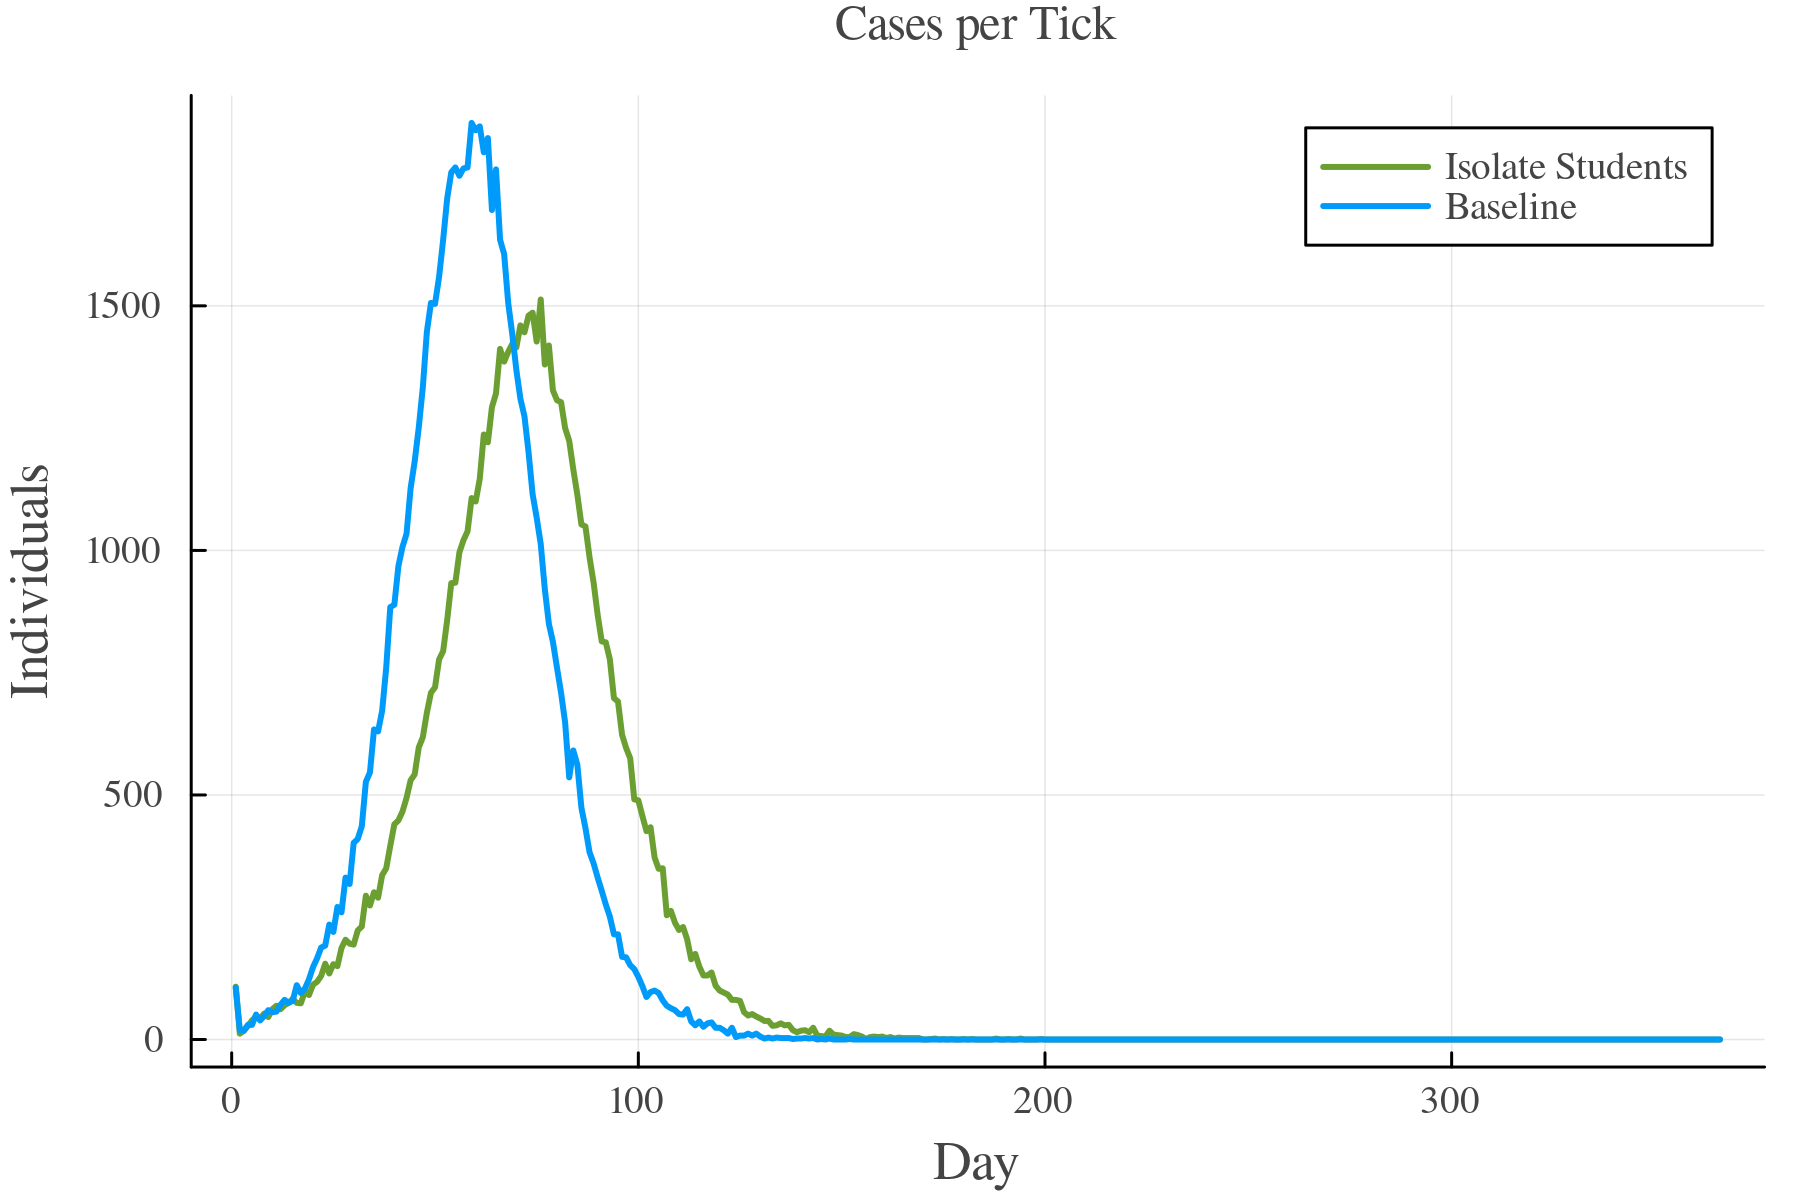
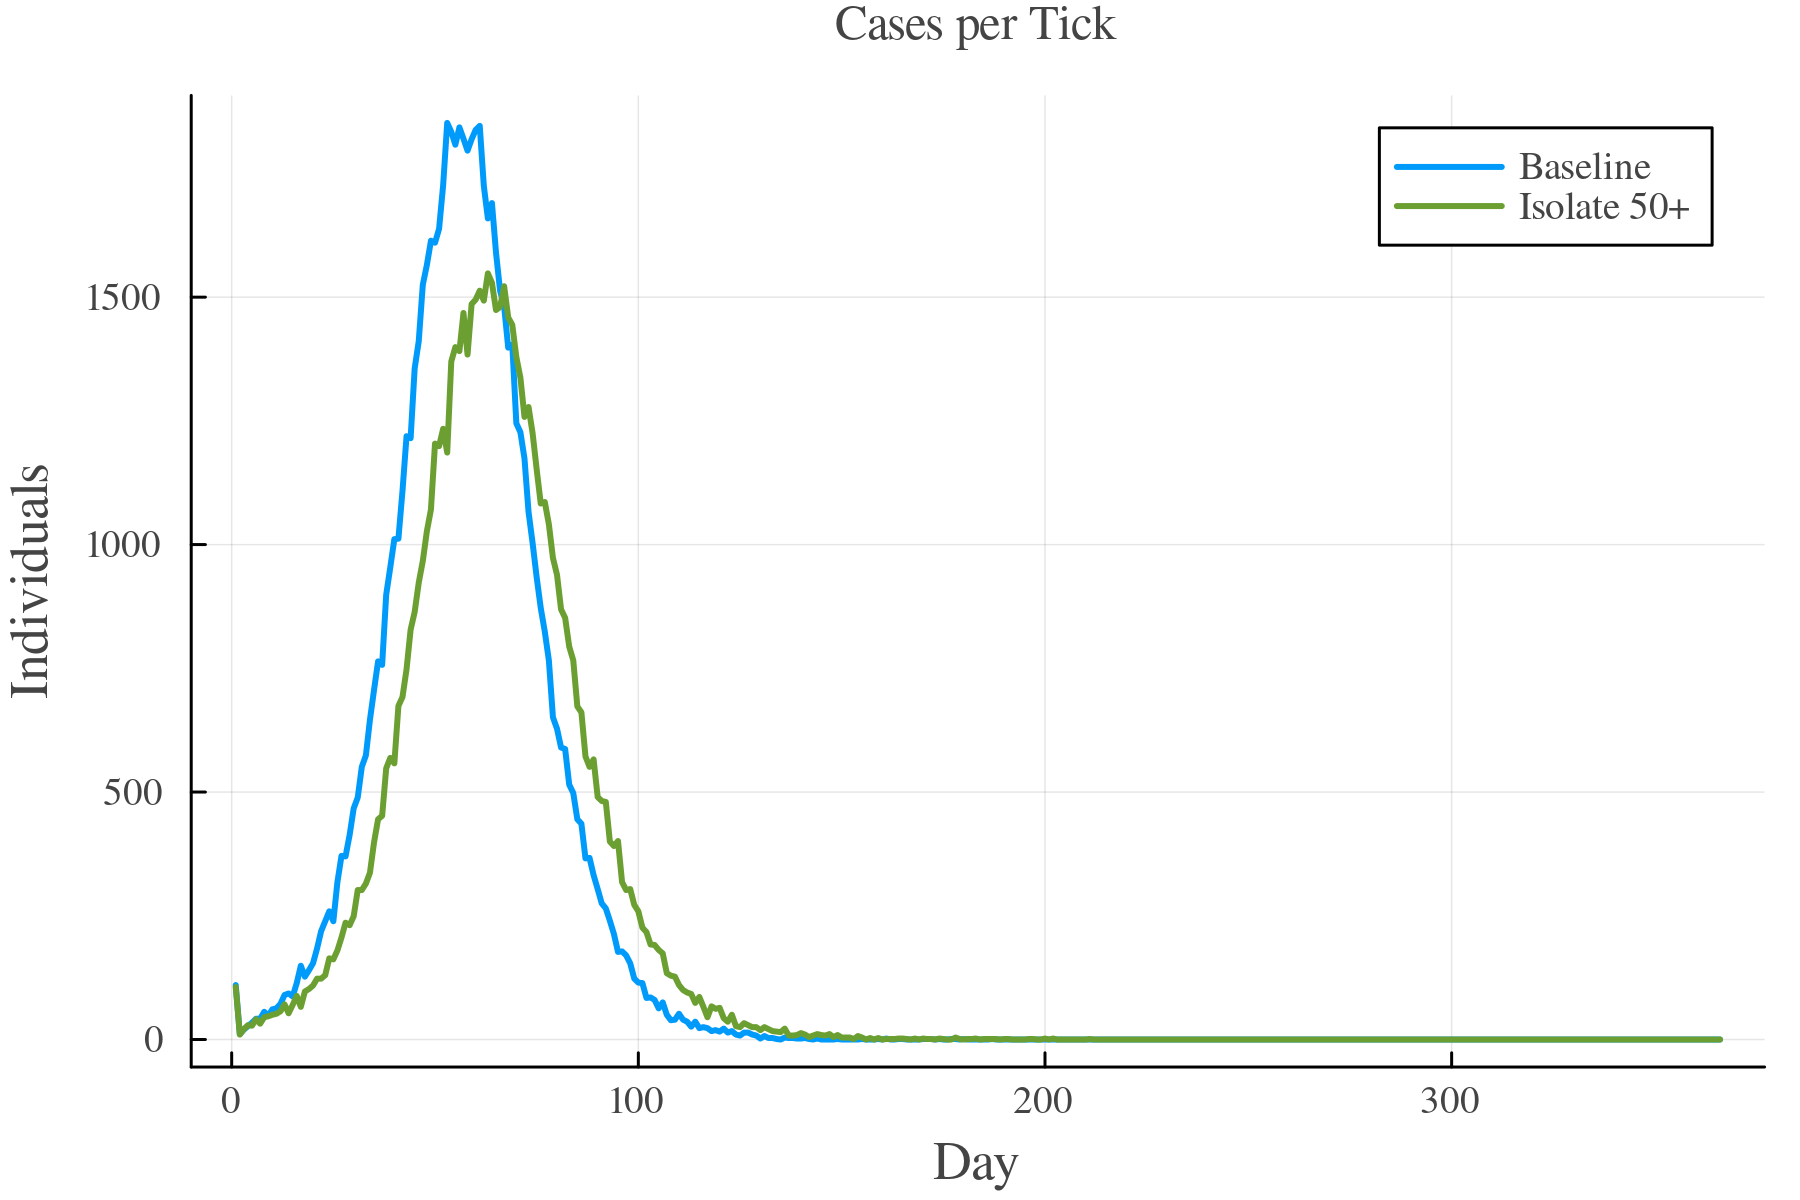
You can also setup a custom condition-function. Here's an example where people who are older than 50 should be isolated.
Scenario Summary:
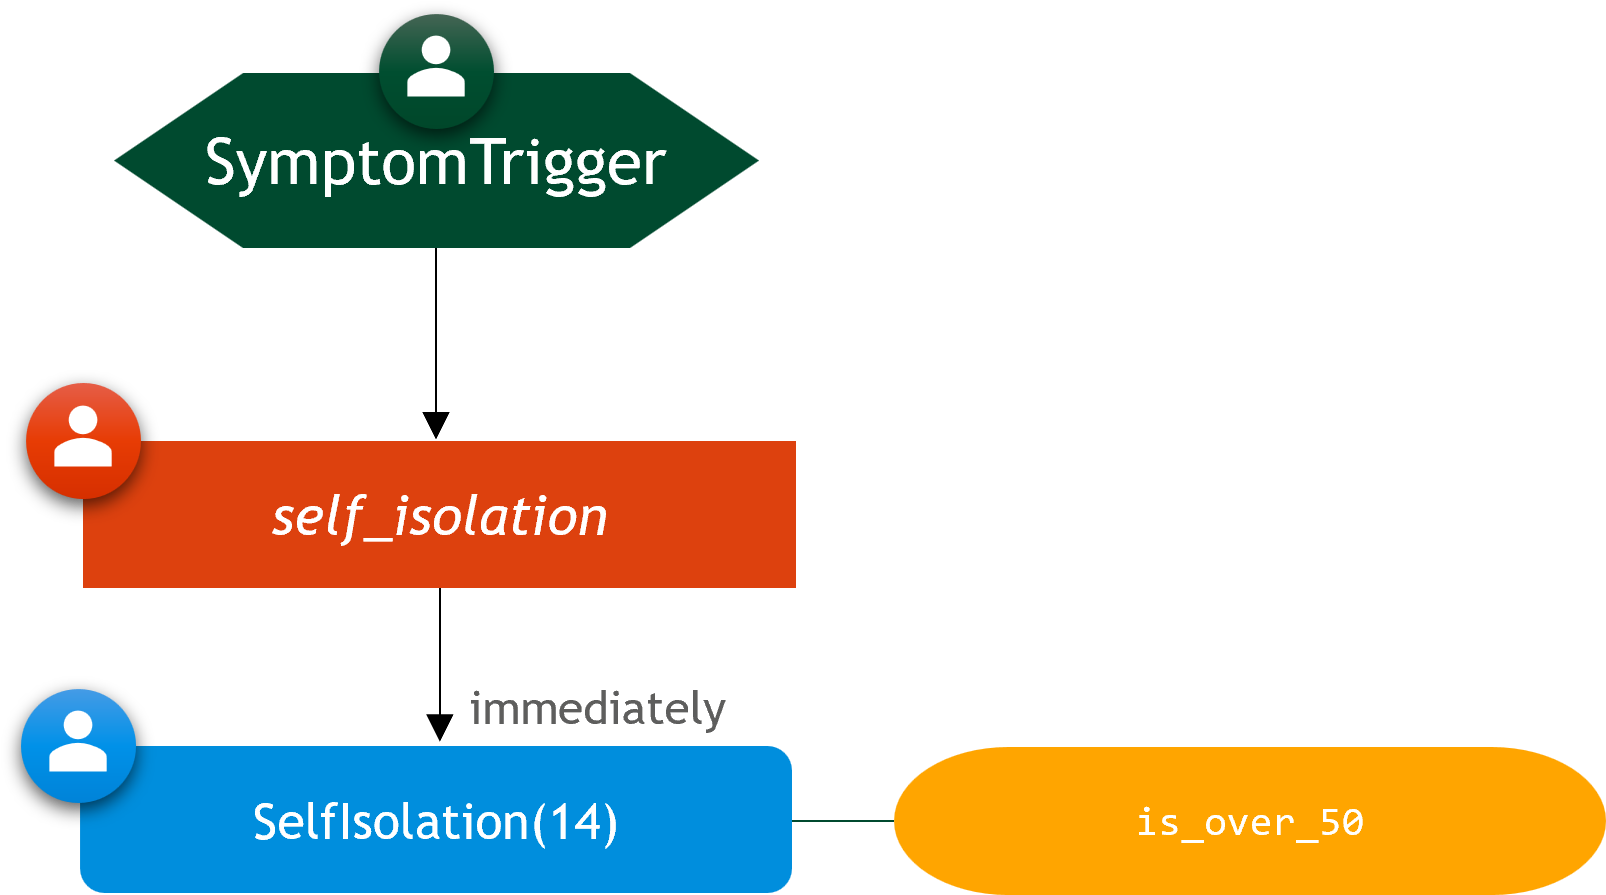
- Individuals of age 50+ go into self-isolation for 14 days, immediately upon experiencing symptoms
- Isolation prevents out-household contacts, but not in-household contacts
- Individuals end their isolation after 14 days, regardless of their infection state
using GEMS
# simulation without interventions
baseline = Simulation(label = "Baseline")

# function to evaluate whether an individual is over 50
function is_over_50(individual)
    return age(individual) >= 50
end

# simulation with 14-day isolation (at home)
# upon experiencing symptoms if you are 50+
scenario = Simulation(label = "Isolate 50+")
self_isolation = IStrategy("Self Isolation", scenario)
add_measure!(self_isolation, SelfIsolation(14), condition = is_over_50)
trigger = SymptomTrigger(self_isolation)
add_symptom_trigger!(scenario, trigger)

run!(baseline)
run!(scenario)

rd_b = ResultData(baseline)
rd_s = ResultData(scenario)

gemsplot([rd_b, rd_s], type = :TickCases)
Plot
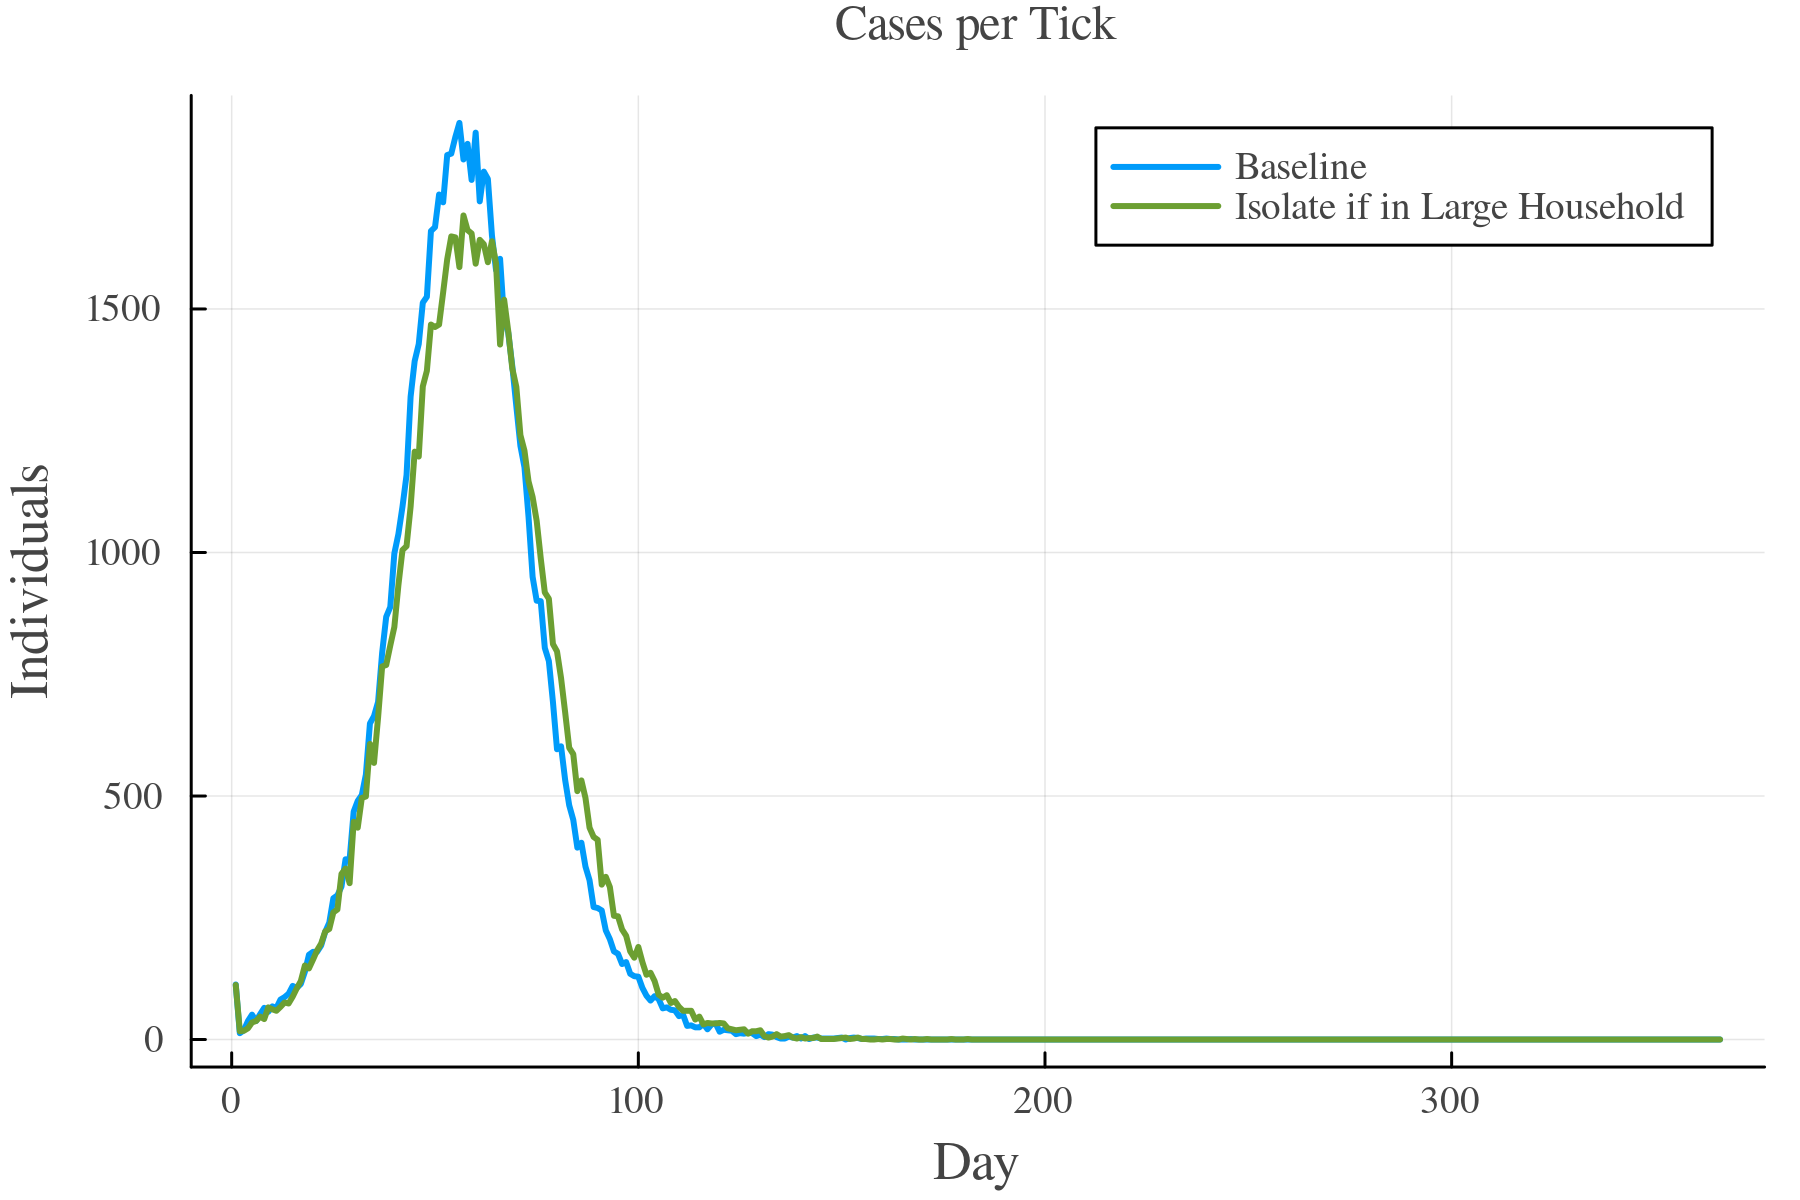
It's also possible to pass (one-argument) lambda functions where the argument will be the individual. In this is example, we only send people into self-isolation who are living in households larger than 5.
Scenario Summary:
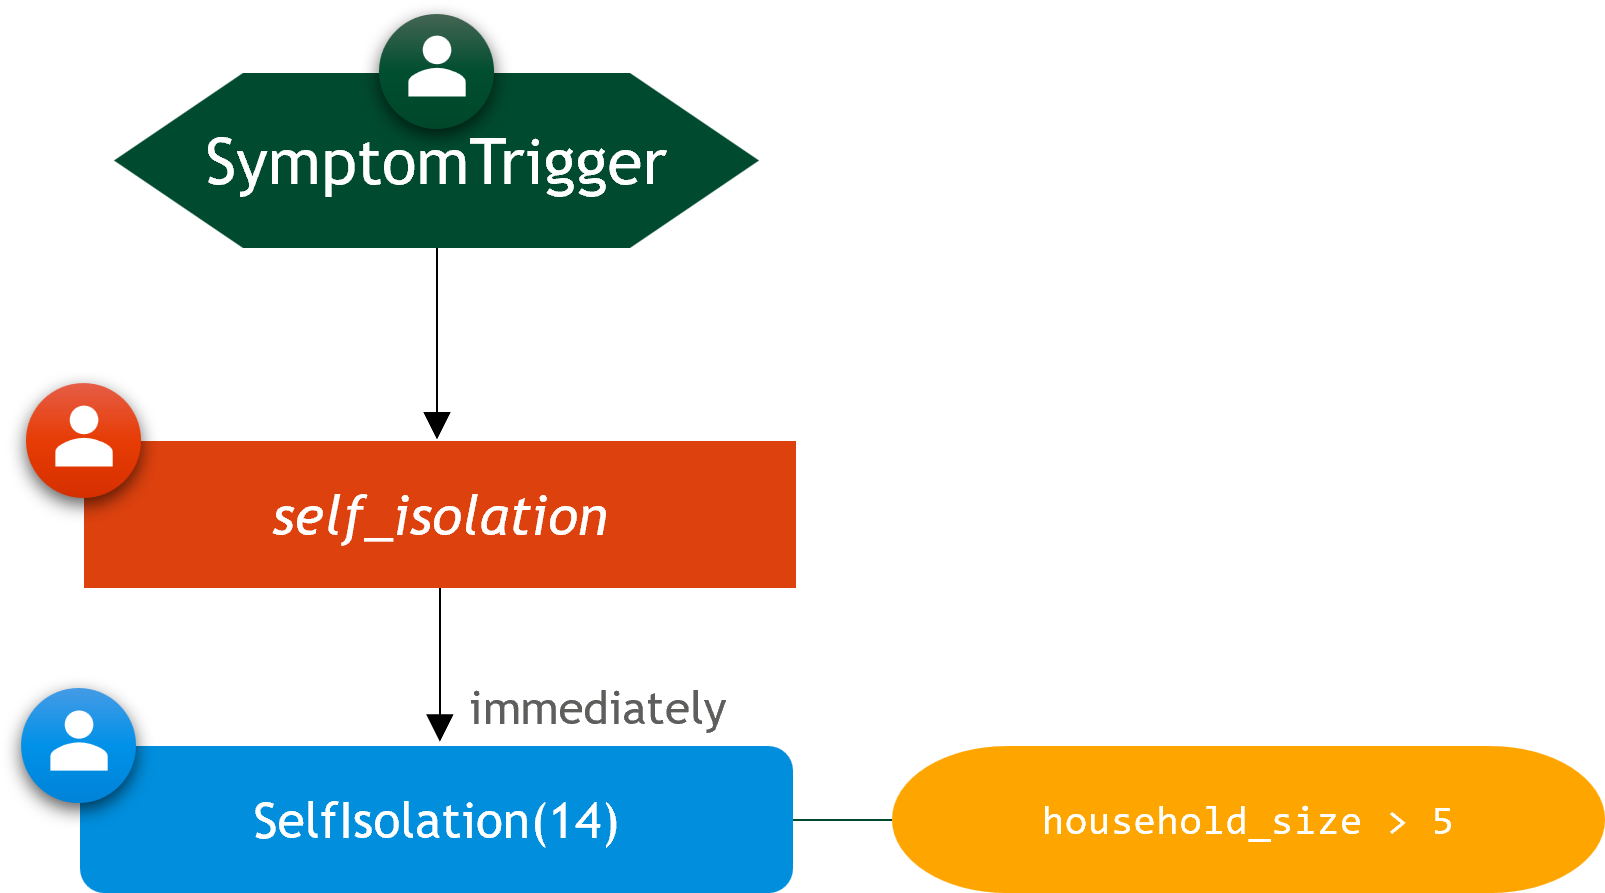
- Individuals living in households of size 5+ go into self-isolation for 14 days, immediately upon experiencing symptoms
- Isolation prevents out-household contacts, but not in-household contacts
- Students end their isolation after 14 days, regardless of their infection state
using GEMS
# simulation without interventions
baseline = Simulation(label = "Baseline")

# simulation with 14-day isolation (at home)
# upon experiencing symptoms if you are a in a 5+ household
scenario = Simulation(label = "Isolate if in Large Household")
self_isolation = IStrategy("Self Isolation", scenario)
add_measure!(self_isolation, SelfIsolation(14),
    condition = i -> size(household(i, scenario)) > 5)
trigger = SymptomTrigger(self_isolation)
add_symptom_trigger!(scenario, trigger)

run!(baseline)
run!(scenario)

rd_b = ResultData(baseline)
rd_s = ResultData(scenario)

gemsplot([rd_b, rd_s], type = :TickCases)
Plot
Yes. In the above examples, we condition measures that apply to individuals (IMeasures). The argument in the condition-functions is the focus individual that this measure applies to. For SMeasures, the argument for the condition-functions is the respective setting.
Household Isolation
The previous examples let a symptomatic individual stay at home but did not force the other household members to do too. If you want to isolate the entire household of symptomatic individuals, the following code will help you. It is very similar to the previous example but instead of triggering the isolation strategy directly, an individual becoming symptomatic will trigger the "find_household_members" strategy that contains a FindSettingMembers measure. This measure is parameterized to detect all members of the individual's Household setting. The members are then all isolated individually, the same way as in the previous example. This can also be considered a form of contact tracing.
Scenario Summary:
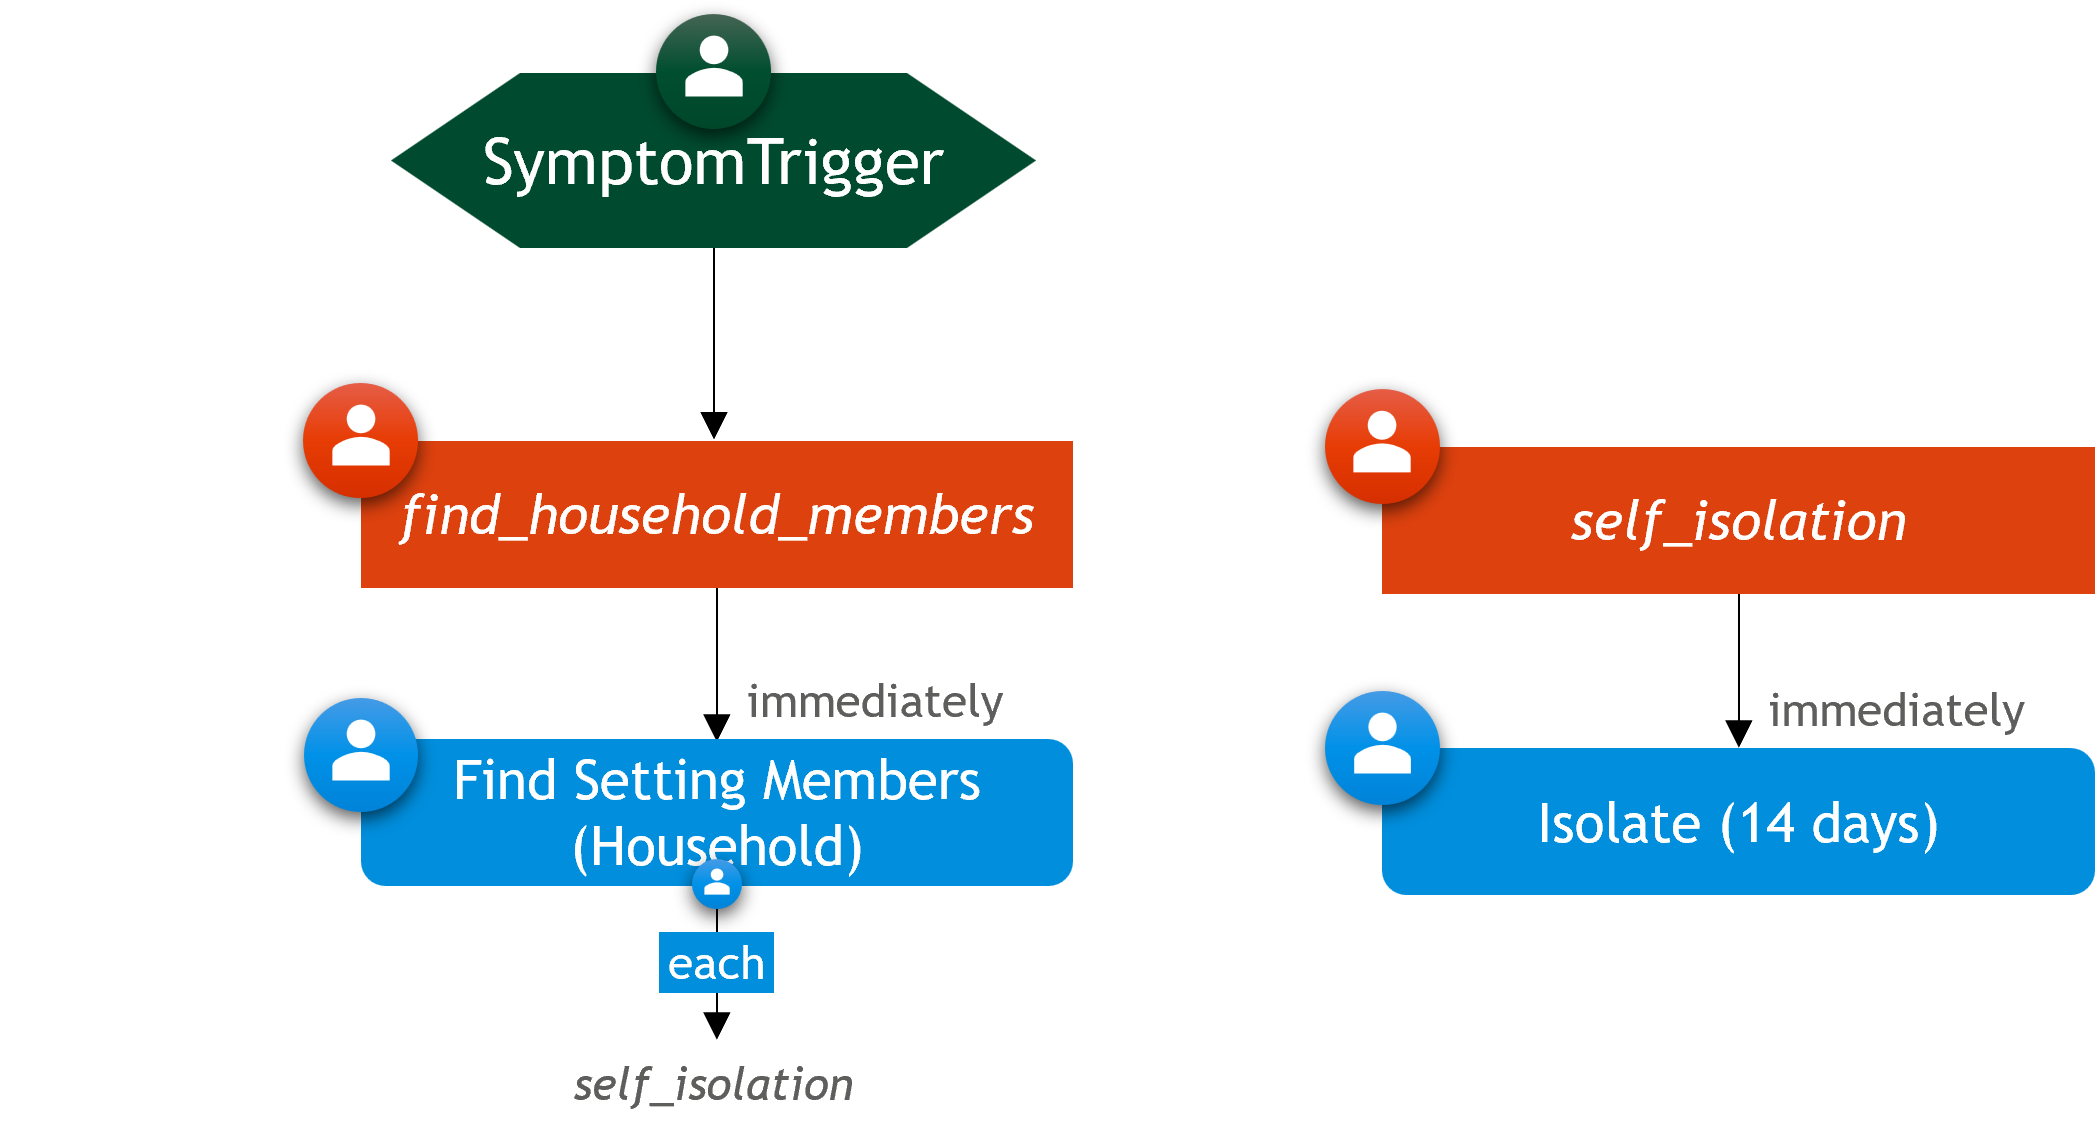
- One individual experiencing symptoms will cause all household members to go into isolation for 14 days
- This prevents all out-household contacts, within household contacts are still possible
- After 14 days, all household members end their isolation, regardless of any of their infection states
using GEMS
# simulation without interventions
baseline = Simulation(label = "Baseline")

# simulation with 14-day isolation for all household members
scenario = Simulation(label = "Scenario")
self_isolation = IStrategy("Self Isolation", scenario)
add_measure!(self_isolation, SelfIsolation(14))
# identify list of household members
find_household_members = IStrategy("Find Household Members", scenario)
add_measure!(find_household_members, FindSettingMembers(Household, self_isolation))
# trigger "household tracing"
trigger = SymptomTrigger(find_household_members)
add_symptom_trigger!(scenario, trigger)

run!(baseline)
run!(scenario)

rd_b = ResultData(baseline)
rd_s = ResultData(scenario)

gemsplot([rd_b, rd_s], type = (:TickCases, :CumulativeIsolations))
Plot
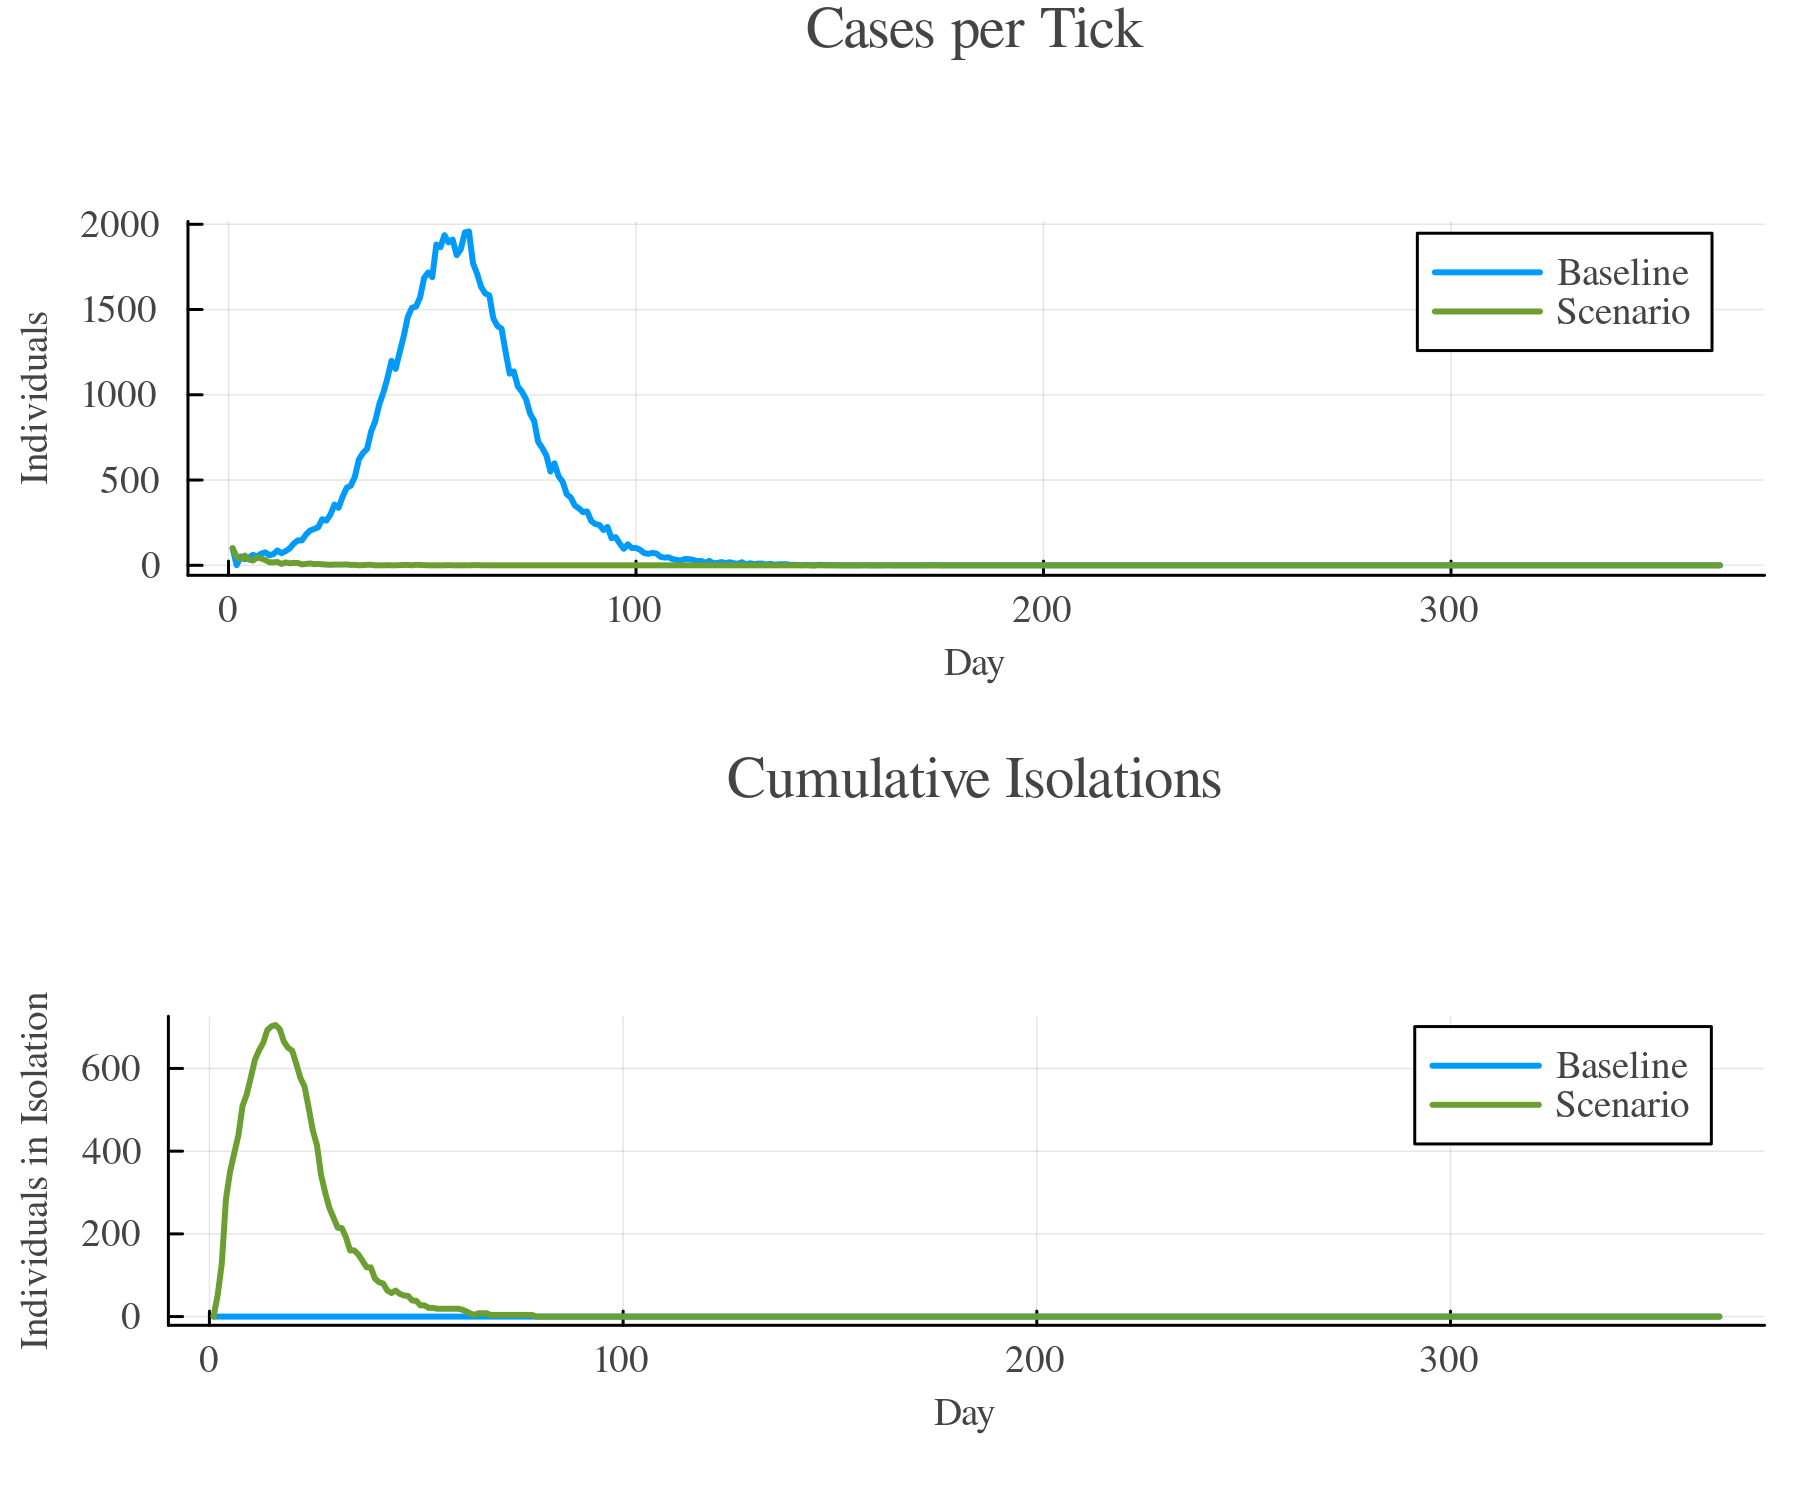
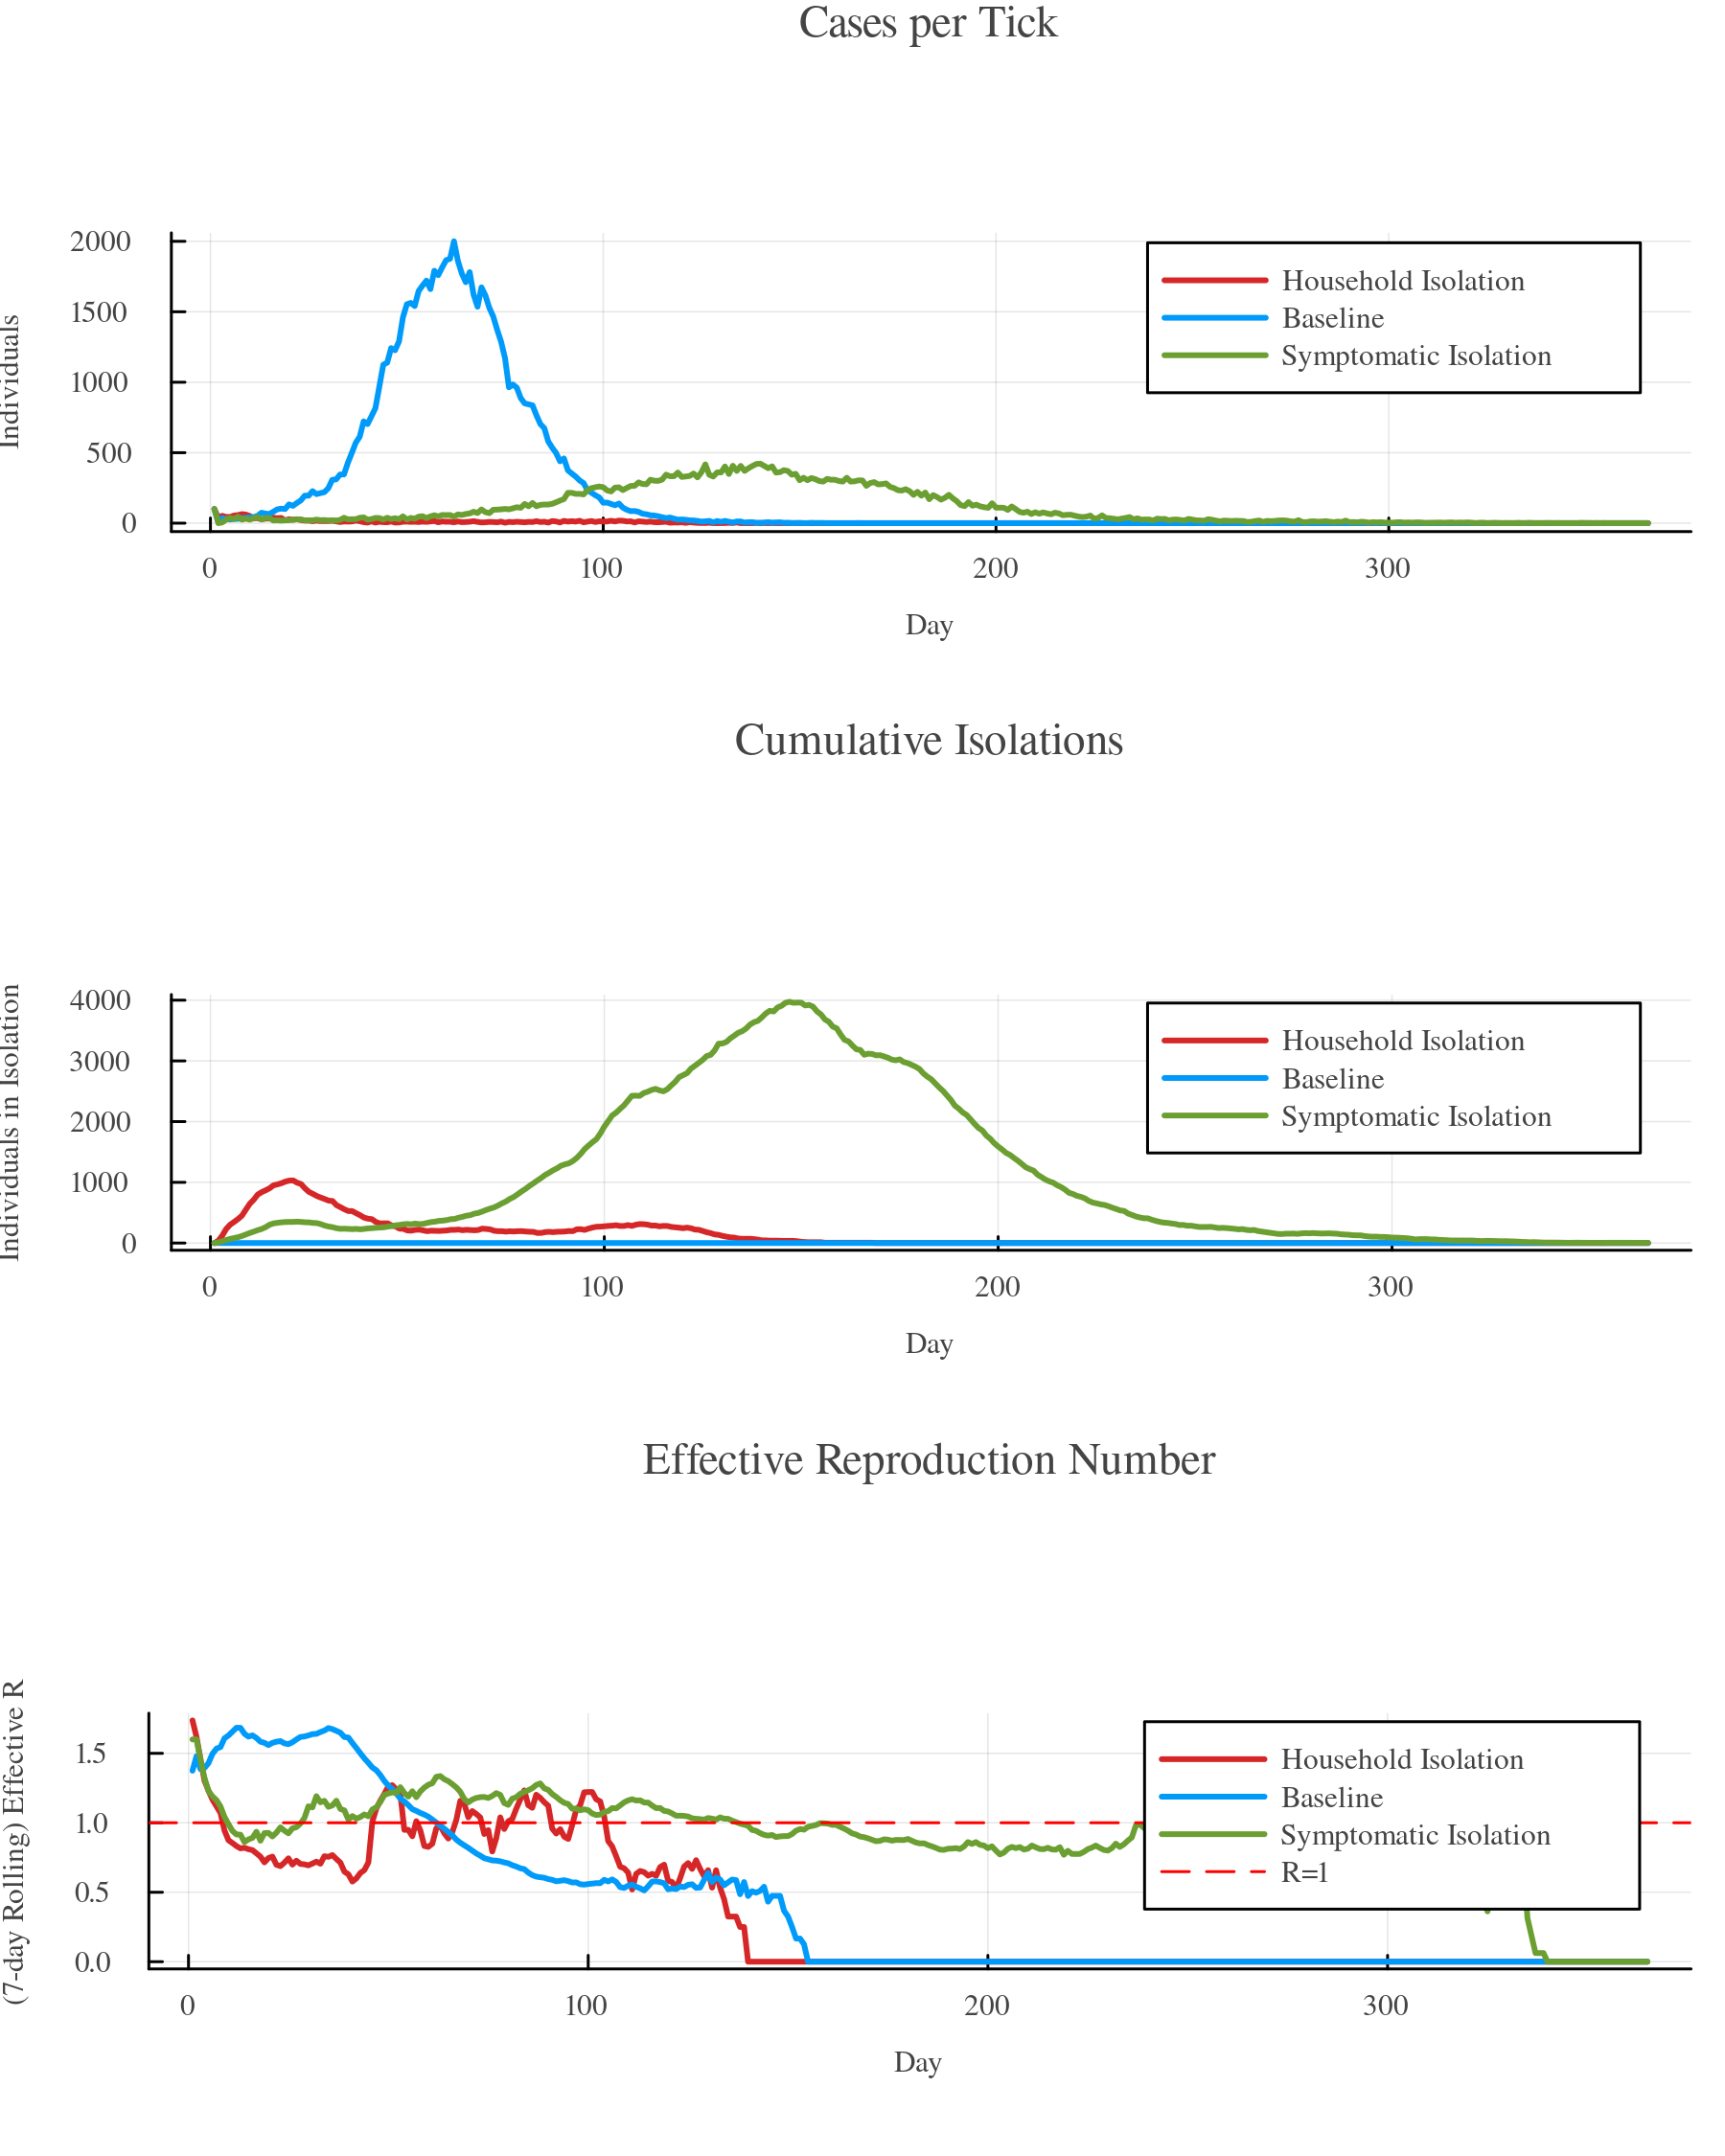
The numbers suggest, that isolating the entire household ends the epidemic within a weeks with only very few cases, compared to isolating only the symptomatic individual, and even with fewer overall isolations. Using gemsplot, you can compare both scenarios and the baseline. The following code combines the previous two examples:
using GEMS
# simulation without interventions
baseline = Simulation(label = "Baseline")

# simulation with 14-day isolation (at home) upon experiencing symptoms
scenario_1 = Simulation(label = "Symptomatic Isolation")
self_isolation = IStrategy("Self Isolation", scenario_1)
add_measure!(self_isolation, SelfIsolation(14))
trigger = SymptomTrigger(self_isolation)
add_symptom_trigger!(scenario_1, trigger)

# simulation with 14-day isolation for all household members
scenario_2 = Simulation(label = "Household Isolation")
self_isolation = IStrategy("Self Isolation", scenario_2)
add_measure!(self_isolation, SelfIsolation(14))
find_household_members = IStrategy("Find Household Members", scenario_2)
add_measure!(find_household_members, FindSettingMembers(Household, self_isolation))
trigger = SymptomTrigger(find_household_members)
add_symptom_trigger!(scenario_2, trigger)

run!(baseline)
run!(scenario_1)
run!(scenario_2)

rd_b = ResultData(baseline)
rd_s1 = ResultData(scenario_1)
rd_s2 = ResultData(scenario_2)

gemsplot([rd_b, rd_s1, rd_s2],
    type = (:TickCases, :CumulativeIsolations, :EffectiveReproduction),
    legend = :topright)
Plot
Testing and Isolation
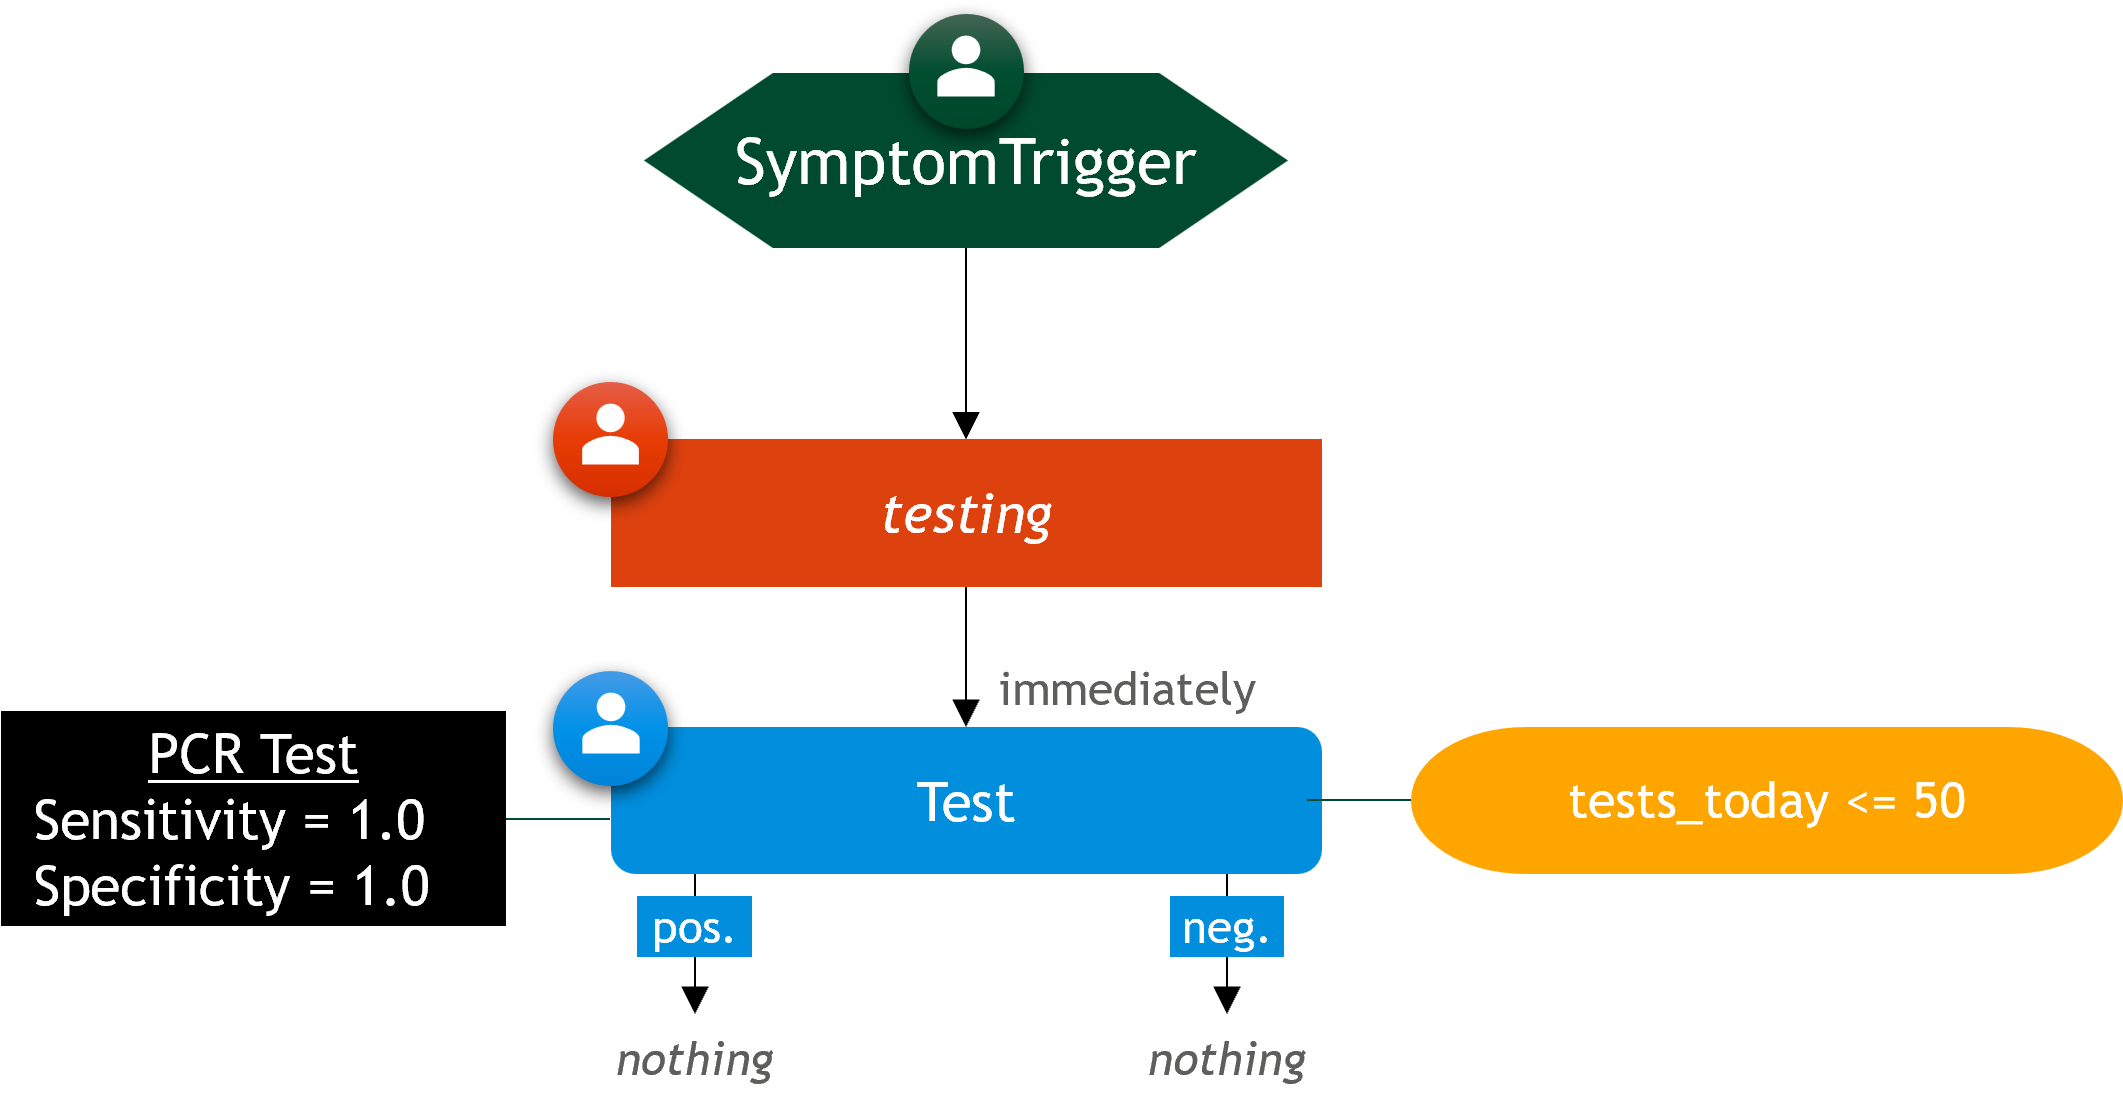
GEMS comes with pre-defined building blocks for modeling testing strategies. The following example subjects symptomatic individuals to a test and isolates them for 14 days, once the test is positive. For that, a TestType is being defined, providing a name ("PCR_Test"), the pathogen (taken from the Simulation object), and the Simulation object itself. The self-isolation strategy is the same as in the first example. However, it is only fired, once an individual is tested positive. This is configured via a second strategy that we call "testing" where we add a Test measure that should use the previously defined "PCRTest" and follow a positive test up with the "self\isolation" strategy. A SymptomTrigger fires the "testing" strategy once an individual becomes symptomatic.
Scenario Summary:
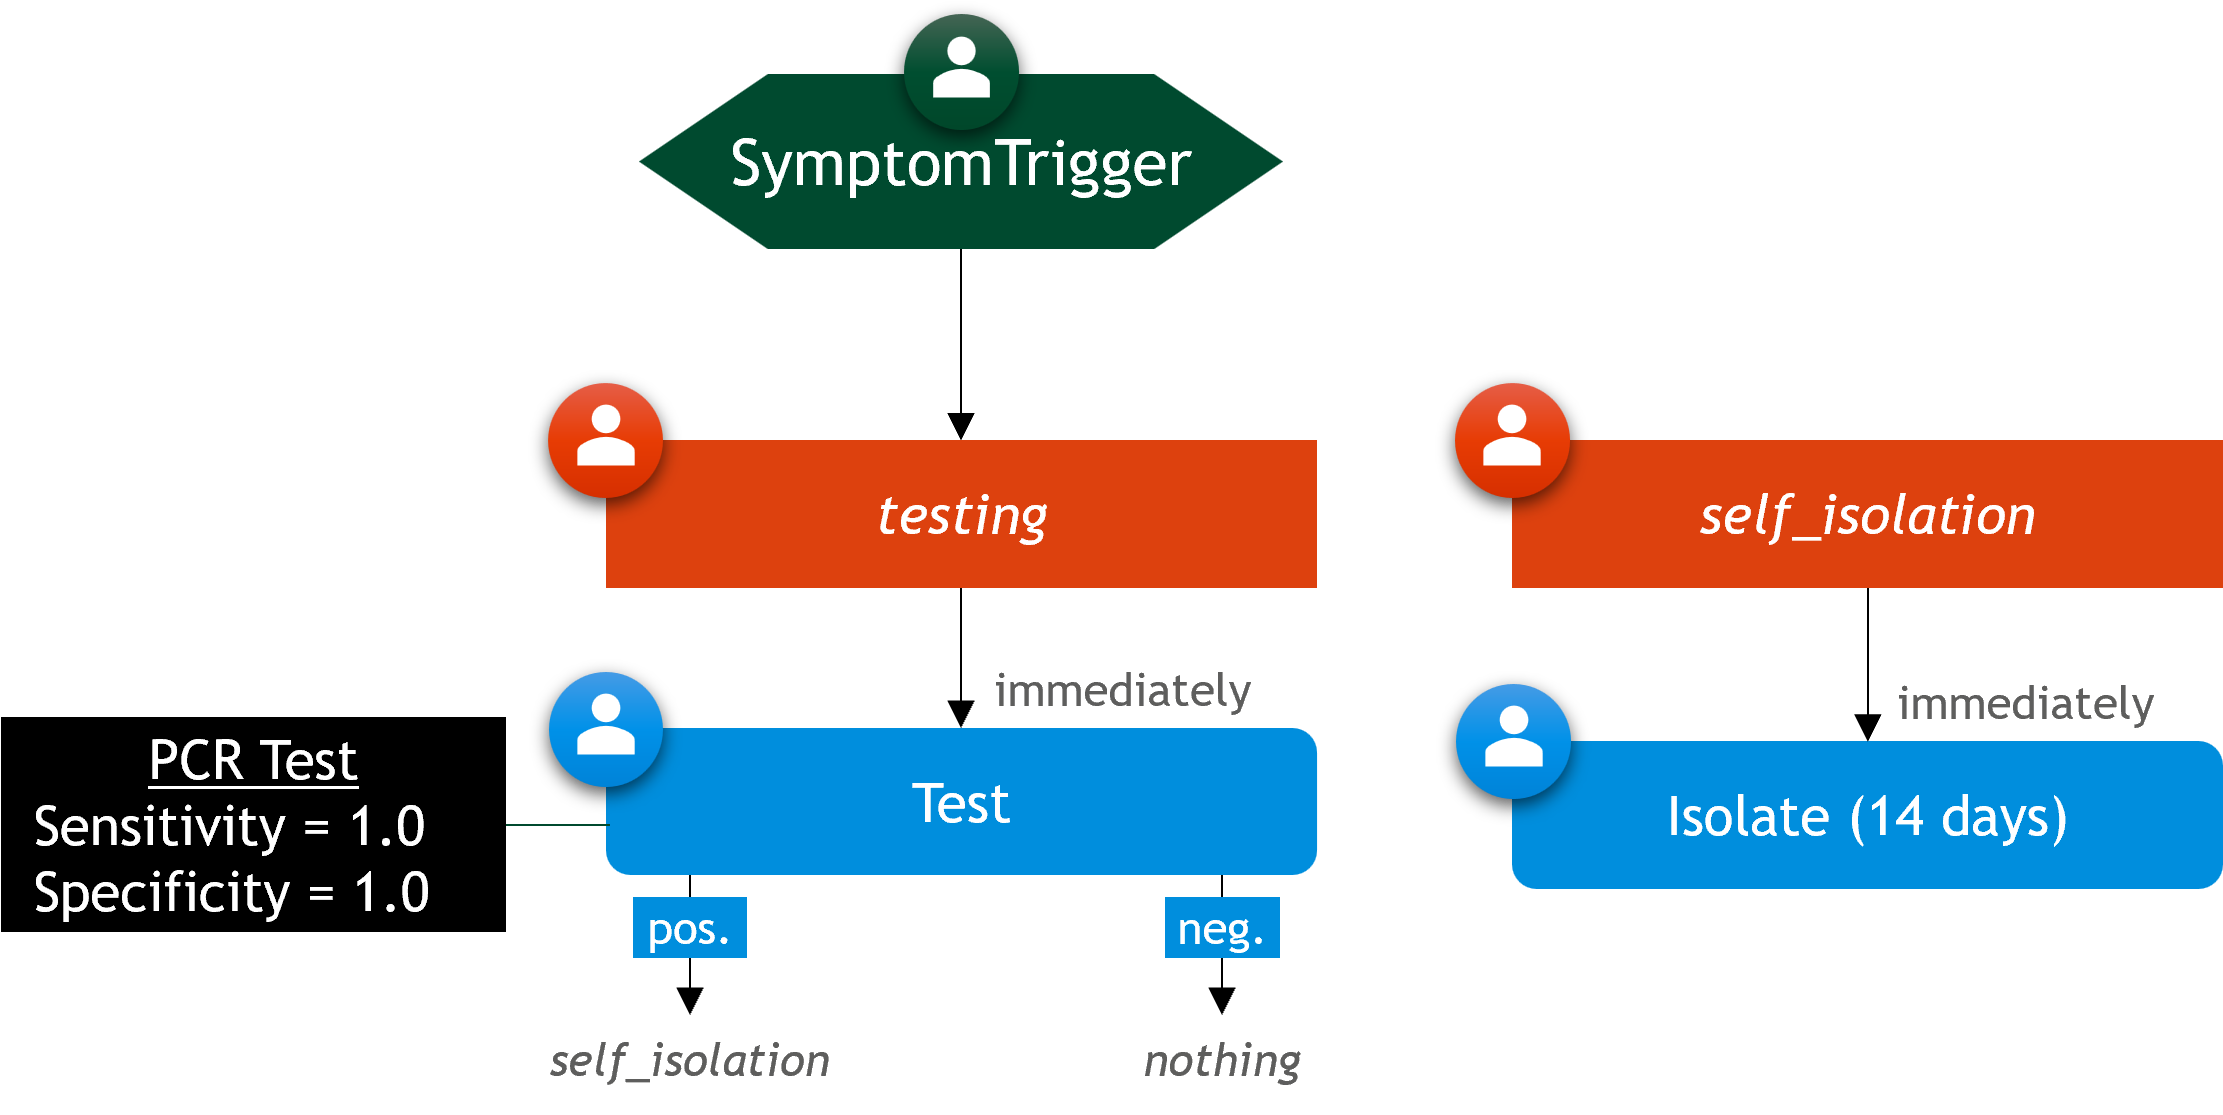
- Upon experiencing symptoms, individuals are being tested immediately
- The test has a 100% sensitivity and 100% specificity
- Test results are available immediately
- If the test result is positive, the individual goes into isolation for 14 days
using GEMS
# simulation without interventions
baseline = Simulation(label = "Baseline")

# simulation with 14-day isolation after positive test
scenario = Simulation(label = "Scenario")
# define test type (PCR test)
PCR_Test = TestType("PCR Test", pathogen(scenario), scenario)
# define self isolation strategy
self_isolation = IStrategy("Self Isolation", scenario)
add_measure!(self_isolation, SelfIsolation(14))
# define testing strategy that triggers self isolation
testing = IStrategy("Testing", scenario)
add_measure!(testing, Test("Test", PCR_Test, positive_followup = self_isolation))

trigger = SymptomTrigger(testing)
add_symptom_trigger!(scenario, trigger)

run!(baseline)
run!(scenario)

rd_b = ResultData(baseline)
rd_s = ResultData(scenario)

gemsplot([rd_b, rd_s], type = (:TickCases, :TickTests, :ActiveDarkFigure), size = (800, 800))
Plot
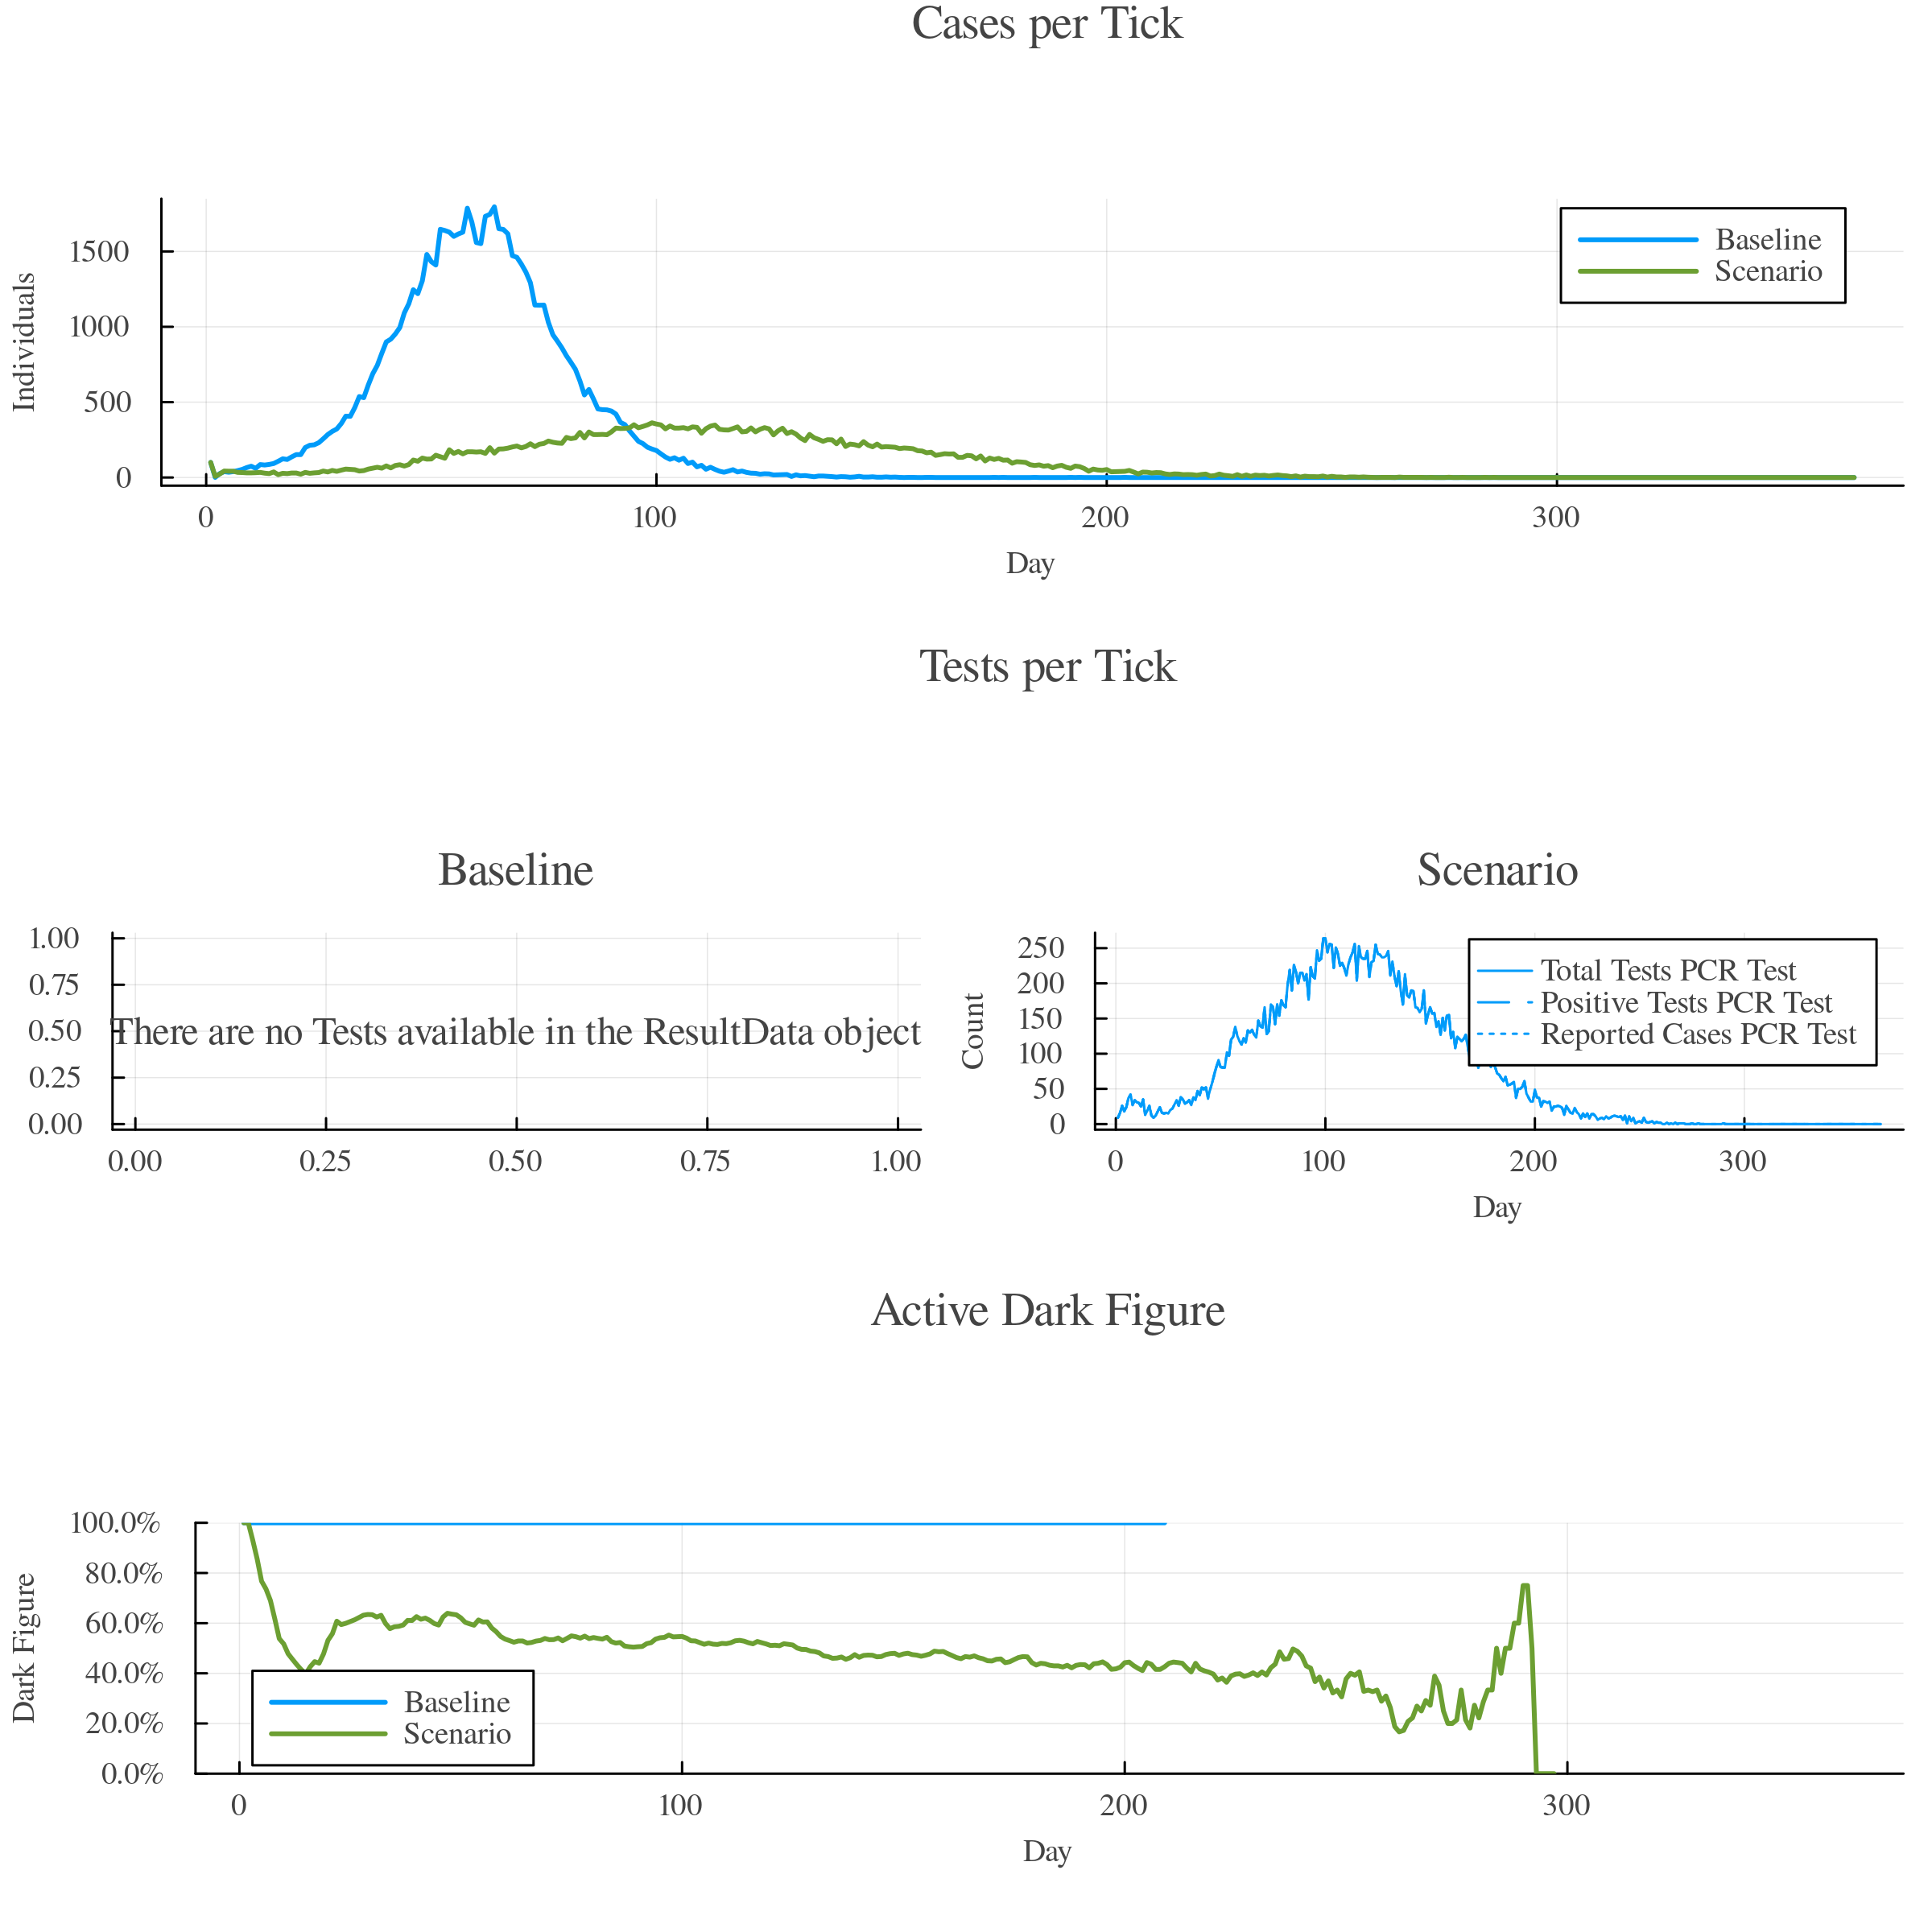
The results are very similar to the first example as all symptomatic individuals are immediately screened with a "perfect" test (100% sensitivity & specificity) and immediately sent in isolation. Of course, in reality this not very realistic. Therefore, GEMS offers options to delay measures (e.g., only getting a test one day after symptom onset). Please look up the respective tutorial.
Delayed Measures (Testing)
The timing of intervention strategies is crucial in most applications. GEMS has two mechanisms to define the execution time of a measure. Both can be passed as optional arguments to the add_measure!(...) function. The offset defines how many ticks should be between the trigger event of a measure's parent strategy and the execution of the respective measure. It's default value is 0. The delay takes a one-argument function that is being evaluated at runtime and needs to return an integer value. These functions work very similar to the condition-function. Please look up the previous example on conditioned measures. The results of this delay-function is added on top of the offset. It can be used to delay the execution of measures, e.g., based on an individual's personal characteristics. In the following scenarios, we compare two scenarios: (1) where individuals get a test immediately and go into isolation if the results come back positive (as in the previous tutorial) and (2) where individuals below the age of 50 get the test immediately an 50+ individuals get them one day after.
Scenario Summary:
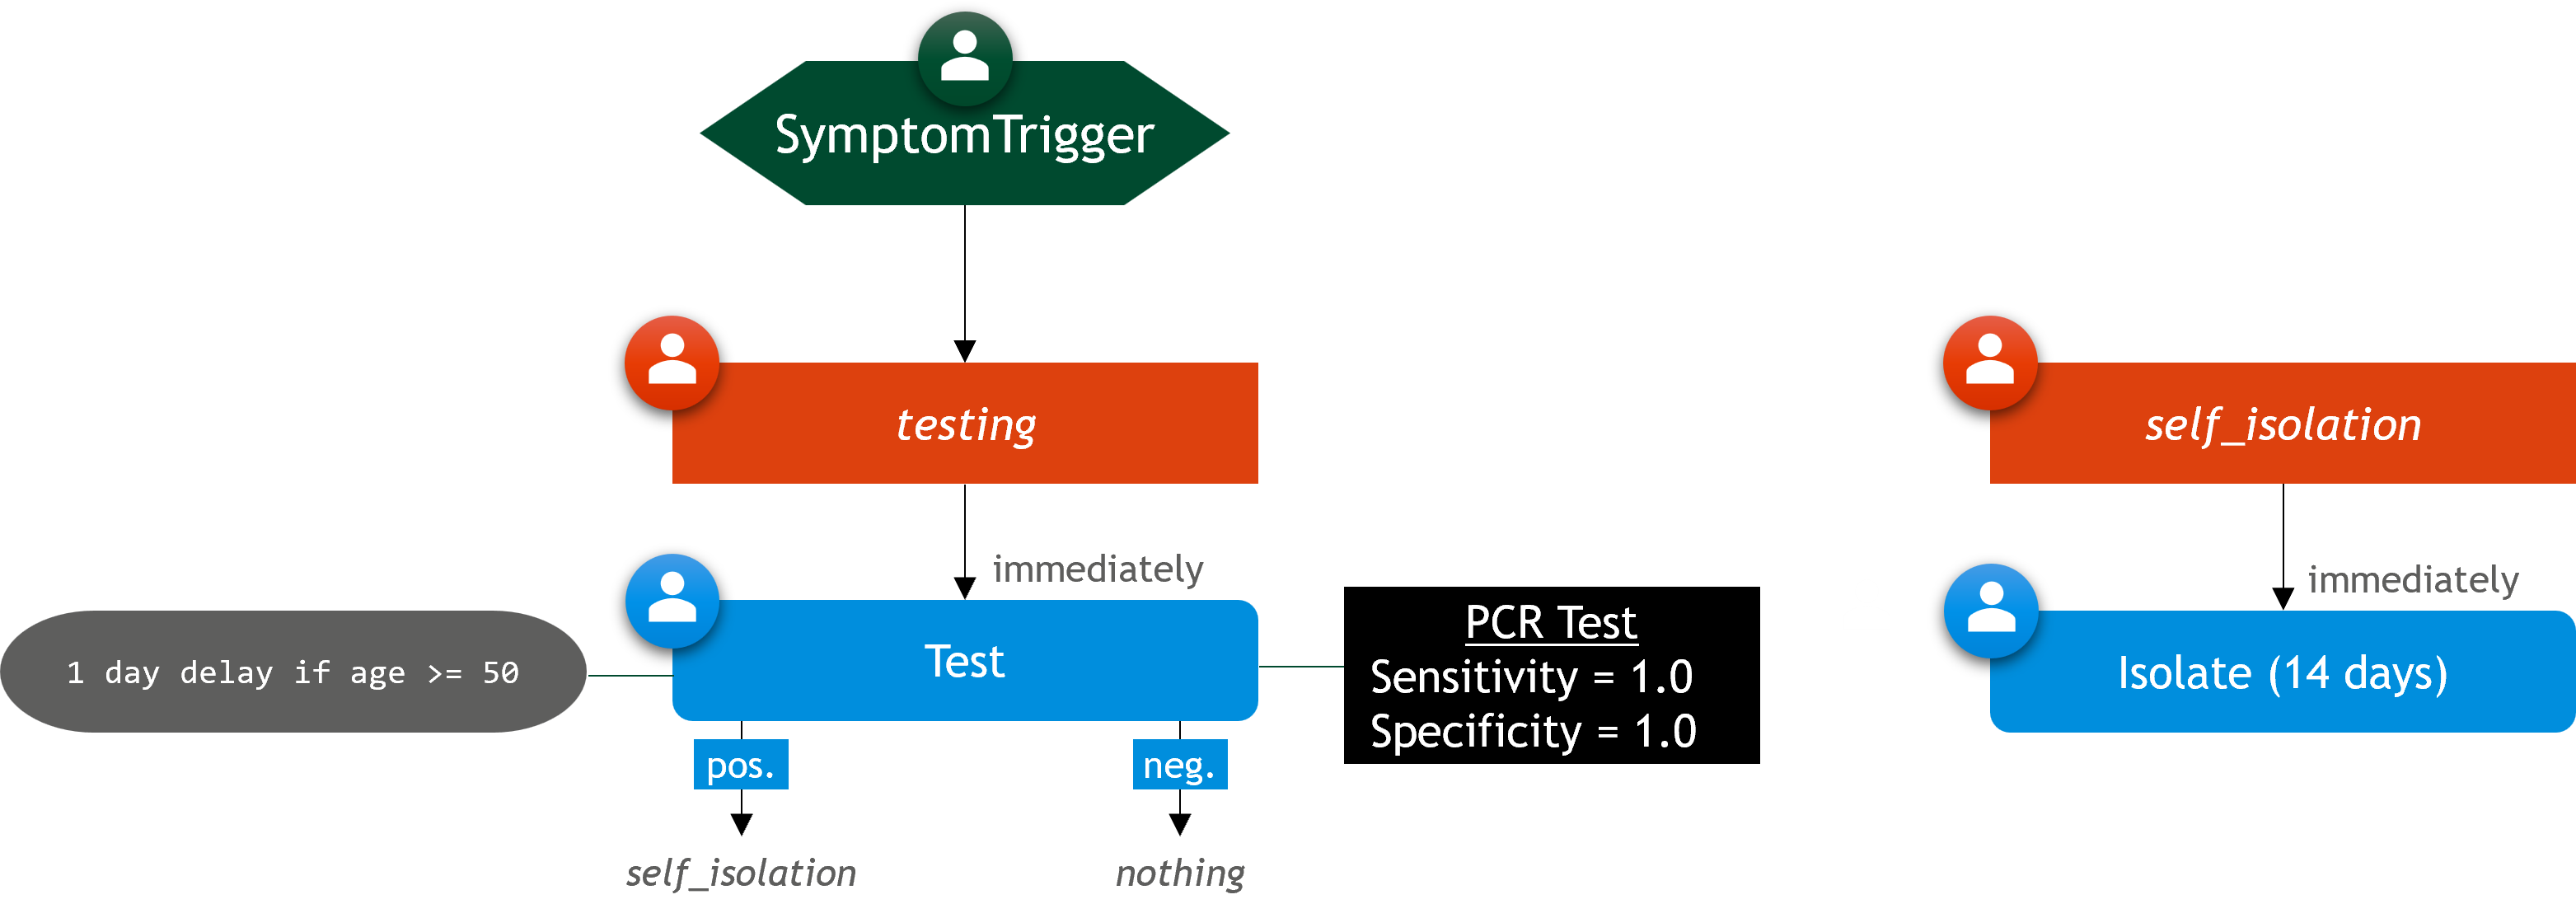
- Upon experiencing symptoms, individuals are being tested
- In scenario 1, tests are being applied immediately. In scenario 2, tests are being applied with a one-day delay for people above the age of 50
- The test has a 100% sensitivity and 100% specificity
- Test results are available immediately
- If the test result is positive, the individual goes into isolation for 14 days
using GEMS, Plots

# SCENARIO 1: No testing delay
scenario_1 = Simulation(label = "No Delay")
PCR_Test_1 = TestType("PCR Test", pathogen(scenario_1), scenario_1)
self_isolation_1 = IStrategy("Self Isolation", scenario_1)
add_measure!(self_isolation_1, SelfIsolation(14))
testing_1 = IStrategy("Testing", scenario_1)
add_measure!(testing_1, Test("Test", PCR_Test_1, positive_followup = self_isolation_1))
trigger_1 = SymptomTrigger(testing_1)
add_symptom_trigger!(scenario_1, trigger_1)

# SCENARIO 2: 1-day delay for 50+ people
scenario_2 = Simulation(label = "1-Day delay for 50+")
PCR_Test_2 = TestType("PCR Test", pathogen(scenario_2), scenario_2)
self_isolation_2 = IStrategy("Self Isolation", scenario_2)
add_measure!(self_isolation_2, SelfIsolation(14))
testing_2 = IStrategy("Testing", scenario_2)
add_measure!(testing_2, Test("Test", PCR_Test_2, positive_followup = self_isolation_2),
    delay = i -> age(i) >= 50 ? 1 : 0) # delay function
trigger_2 = SymptomTrigger(testing_2)
add_symptom_trigger!(scenario_2, trigger_2)

# run everything
b = Batch(scenario_1, scenario_2)
run!(b)
rd = ResultData(b)

plot(
    gemsplot(rd, type = :TickCases),
    gemsplot(rd, type = :TimeToDetection, ylims = (0, 6)),
    layout = (2, 1),
    size = (800, 800)
)
Plot
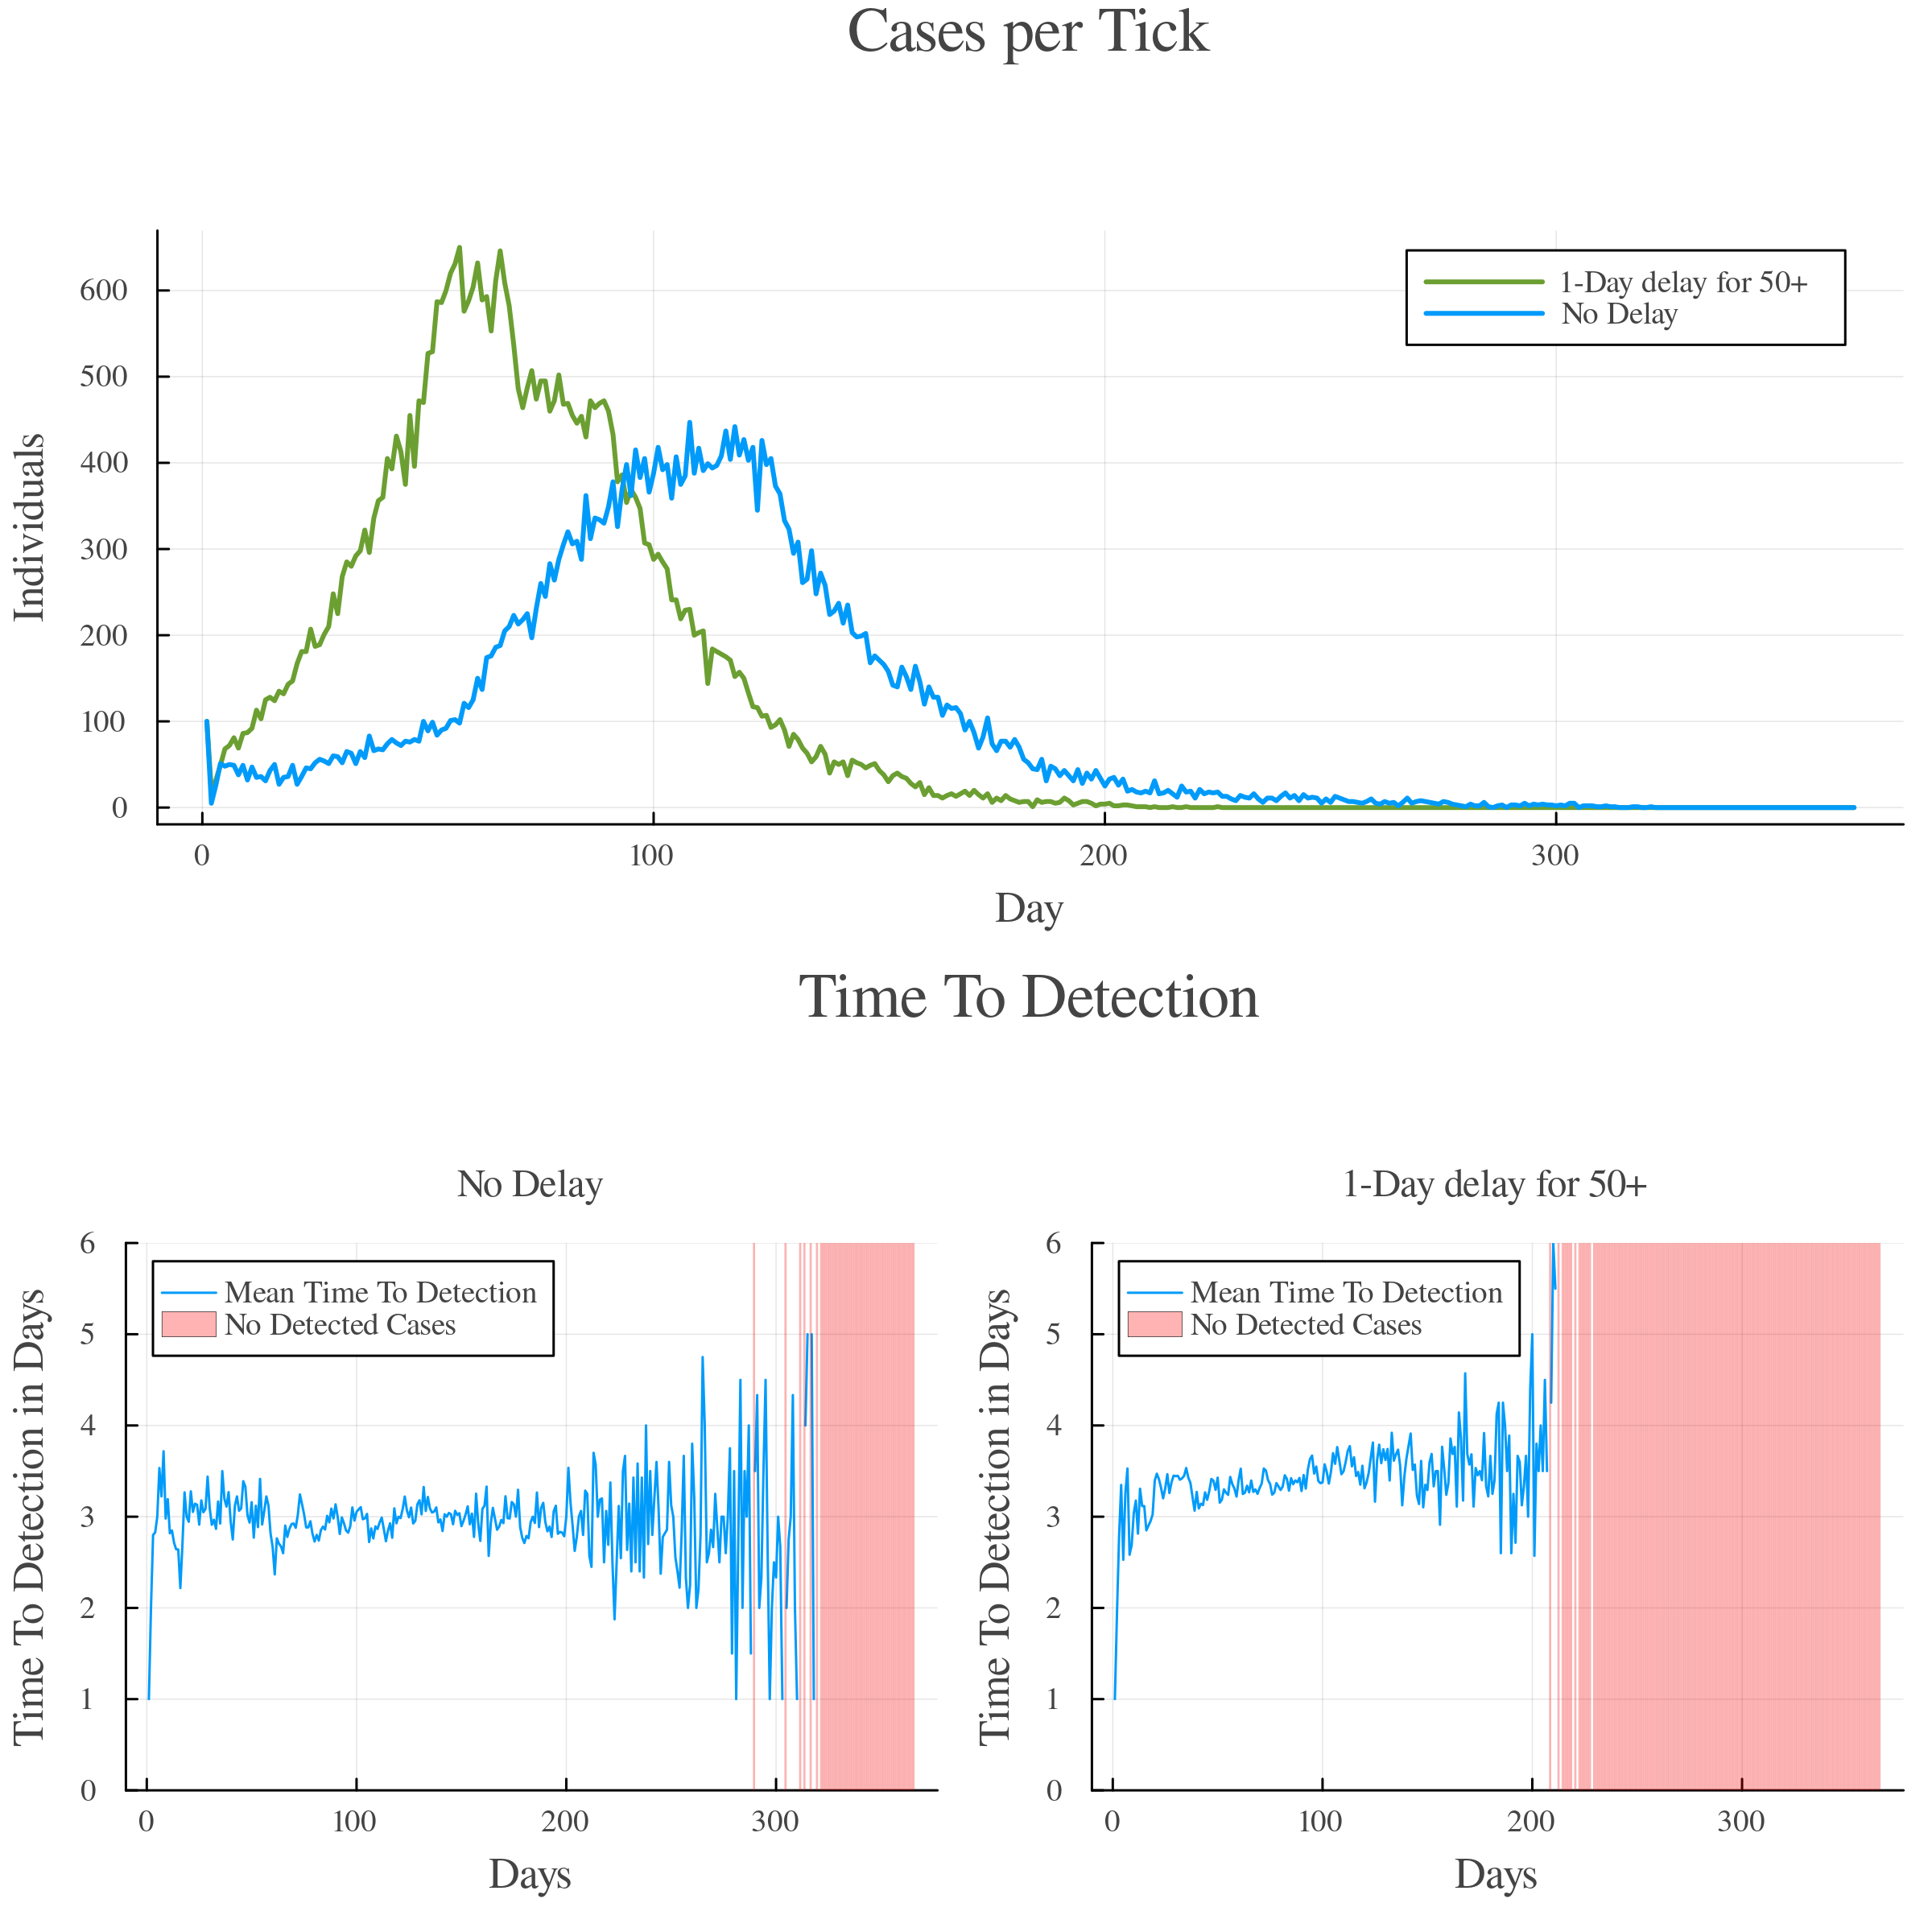
The above plot shows that just a one-day delay for just a fraction of the individuals can have a substantial impact on the overall daily cases. The Time-To-Detection plot visualizes the average time between exposure and a positive test result. You can see that the average time is around half a day longer in the delayed scenario.
Subpar Test (Poor Specificity)
Mass-testing strategies can lead to a large number of individuals in isolation who are not actually infected if the test has a low specificity (false-positive-rate). In GEMS you can easily estimate the impact of subpar testing kits. In the example below, we assume a test with a 20% false-positive-rate (80% specificity). Once an individual experiences symptoms, all members of their household (including themselves) are subjected to a test and sent into household isolation for two weeks if the results are positive.
Scenario Summary:
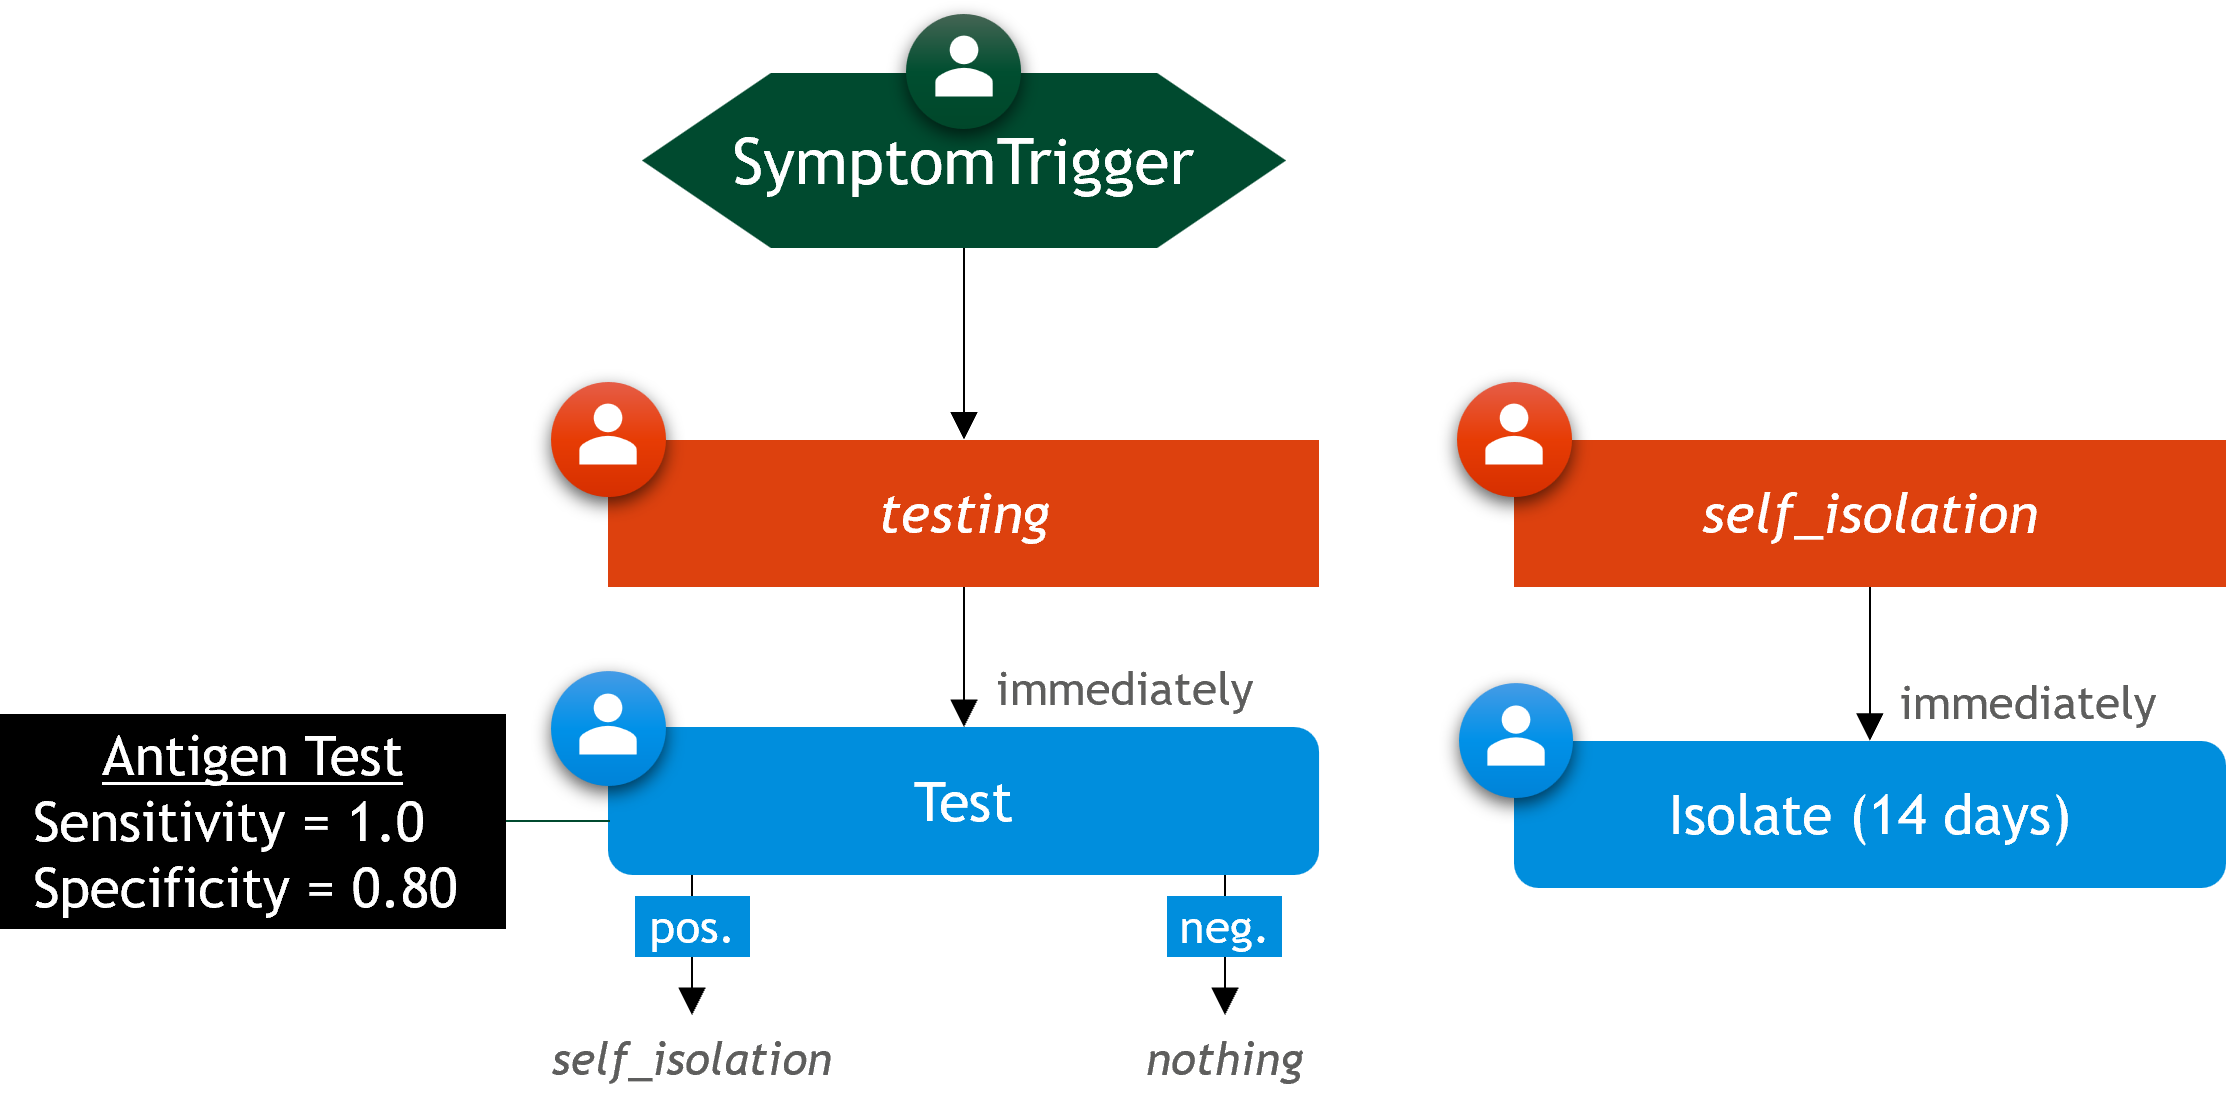
- Upon experiencing symptoms, all people in the symptomatic individual's household get tested (including the index individual)
- The test has a specificity of 80%. It will identify a non-infected individual as infected in 20% of the cases (false positives)
- If multiple people in the household are infected, each individual will get tested multiple times
- Test results are available immediately
- With a positive test result, the individual will go into self-isolation for 14 days
- Make this disease in this scenario slightly more infectious (.25 transmission rate) to get an epidemic curve.
using GEMS, Plots

scenario = Simulation(label = "Household Testing", transmission_rate = .25)

# isolation strategy (14 days)
self_isolation = IStrategy("Self Isolation", scenario)
add_measure!(self_isolation, SelfIsolation(14))

# subpar test (80% specificity)
antigen_test = TestType("Antigen Test", pathogen(scenario), scenario, specificity = 0.8)

# testing strategy
testing = IStrategy("Testing", scenario)
add_measure!(testing, Test("Household Screening", antigen_test,
    positive_followup = self_isolation))

# strategy to detect household members
find_household = IStrategy("find Household Members", scenario)
add_measure!(find_household, FindSettingMembers(Household, testing))

# trigger household member identification
trigger = SymptomTrigger(find_household)
add_symptom_trigger!(scenario, trigger)

# setup count functions & custom logger
cnt_isolated_infected(sim) =
    count(i -> (isquarantined(i) && infected(i)), population(sim))
cnt_isolated_non_infected(sim) =
    count(i -> (isquarantined(i) && !infected(i)), population(sim))
cl = CustomLogger(
    isolated_infected = cnt_isolated_infected,
    isolated_non_infected = cnt_isolated_non_infected)
customlogger!(scenario, cl)

# run simulation & plot results
run!(scenario)
rd = ResultData(scenario)
plot(
    gemsplot(rd, type = :DetectedCases),
    gemsplot(rd, type = :CustomLoggerPlot, ylims = (0, 2000)),
    layout = (2, 1),
    size = (800, 800))
Plot
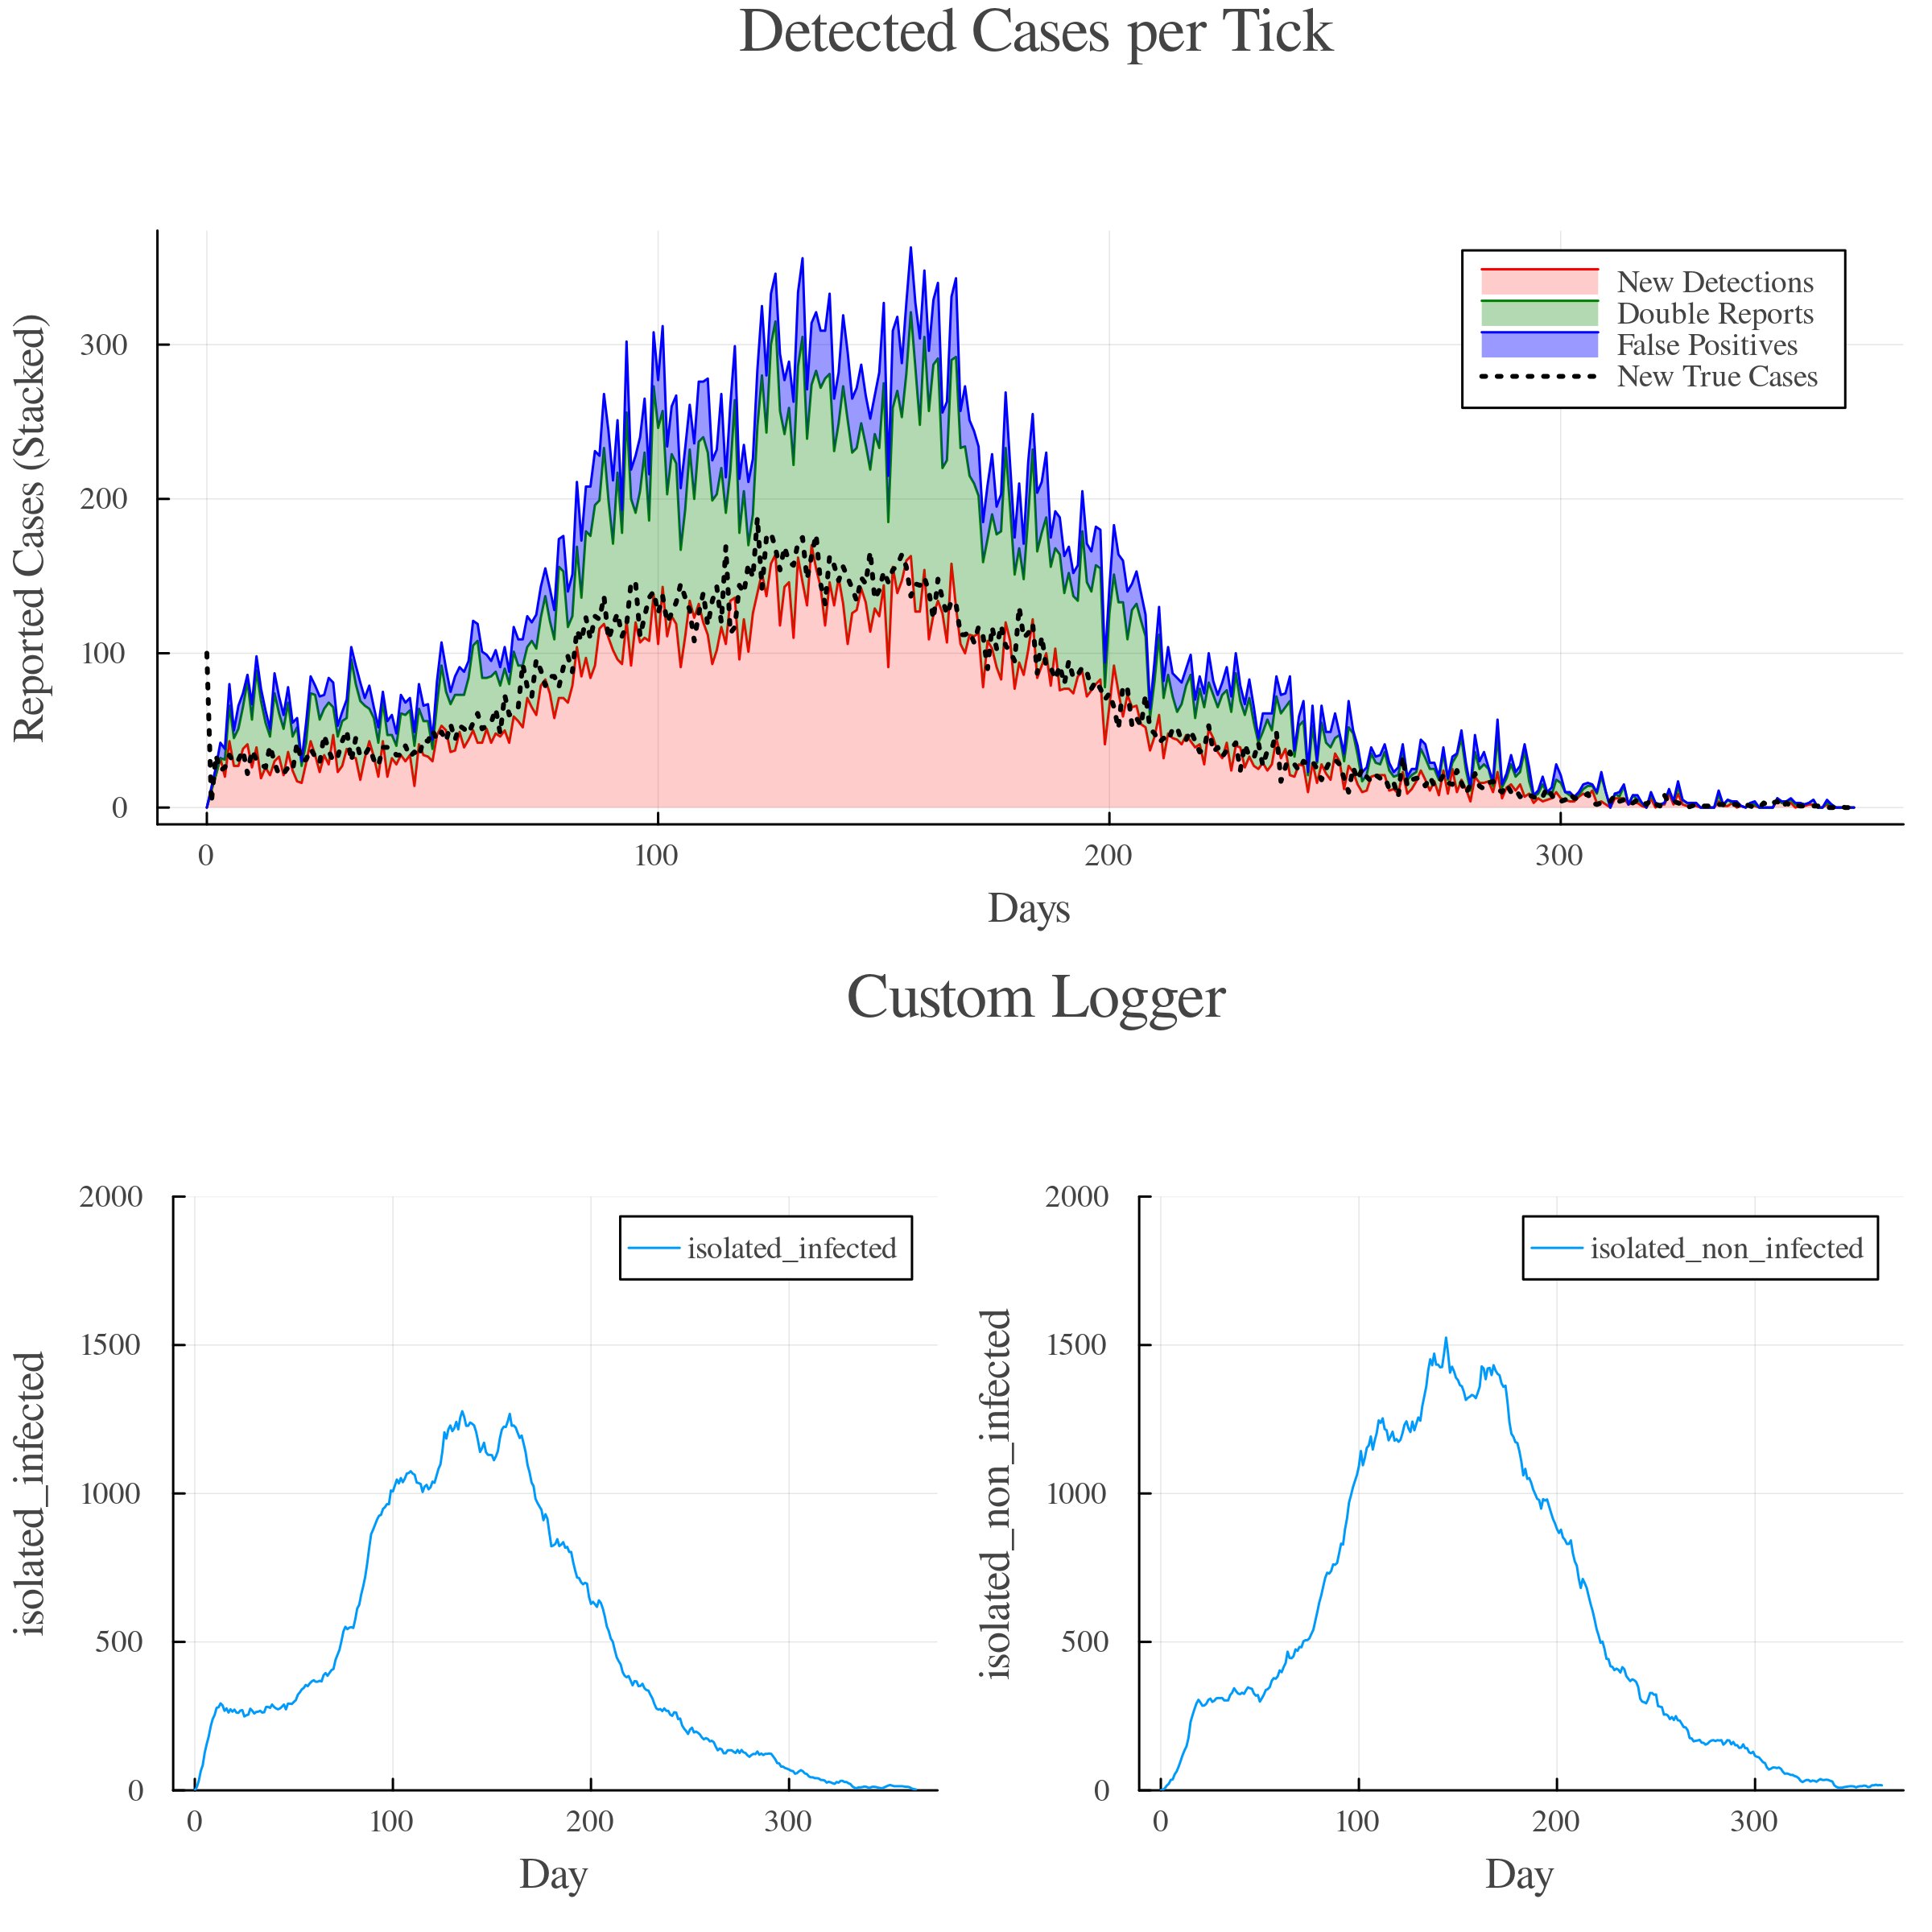
The "detected cases" plot now shows that there are more reported cases (sum of the stacked areas) than true new cases (black dotted line). This is interesting considering, that only 60% of the individual will trigger the strategy (40% are asymptomatic). The extensive testing strategy combined with the poor test quality leads to a substantial number of double reports (individuals who are tested positive multiple times) and false positives (individuals who tested positive without being infected). It can be seen that the number of isolated non-infected individuals peak higher than actually infected individuals in isolation, even though we only send people into isolation if they produced a positive test result.
Ghost Epidemic
In this example, we show how a test with low specificity can cause a "ghost" epidemic. We start with the initial 100 infections in the default model and set the transmission_rate to 0, effectively preventing all further infections. For each of the 100 initial infections, we sample 10 random individuals ("contacts") from the GlobalSetting (the setting that contains all individuals in the simulation). We subject these selected contacts to a test with low specificity (85%), which causes a false positive result in 15% of the cases. A positive test will again trigger the selection of 10 more random contacts. We assume that this is a very basic form of "contact tracing".
Note: In the example below, we first define all strategies and add measures later. That's necessary enable the recursive execution of strategies (they have to be "known" in order to reference them in measures).
Scenario Summary:
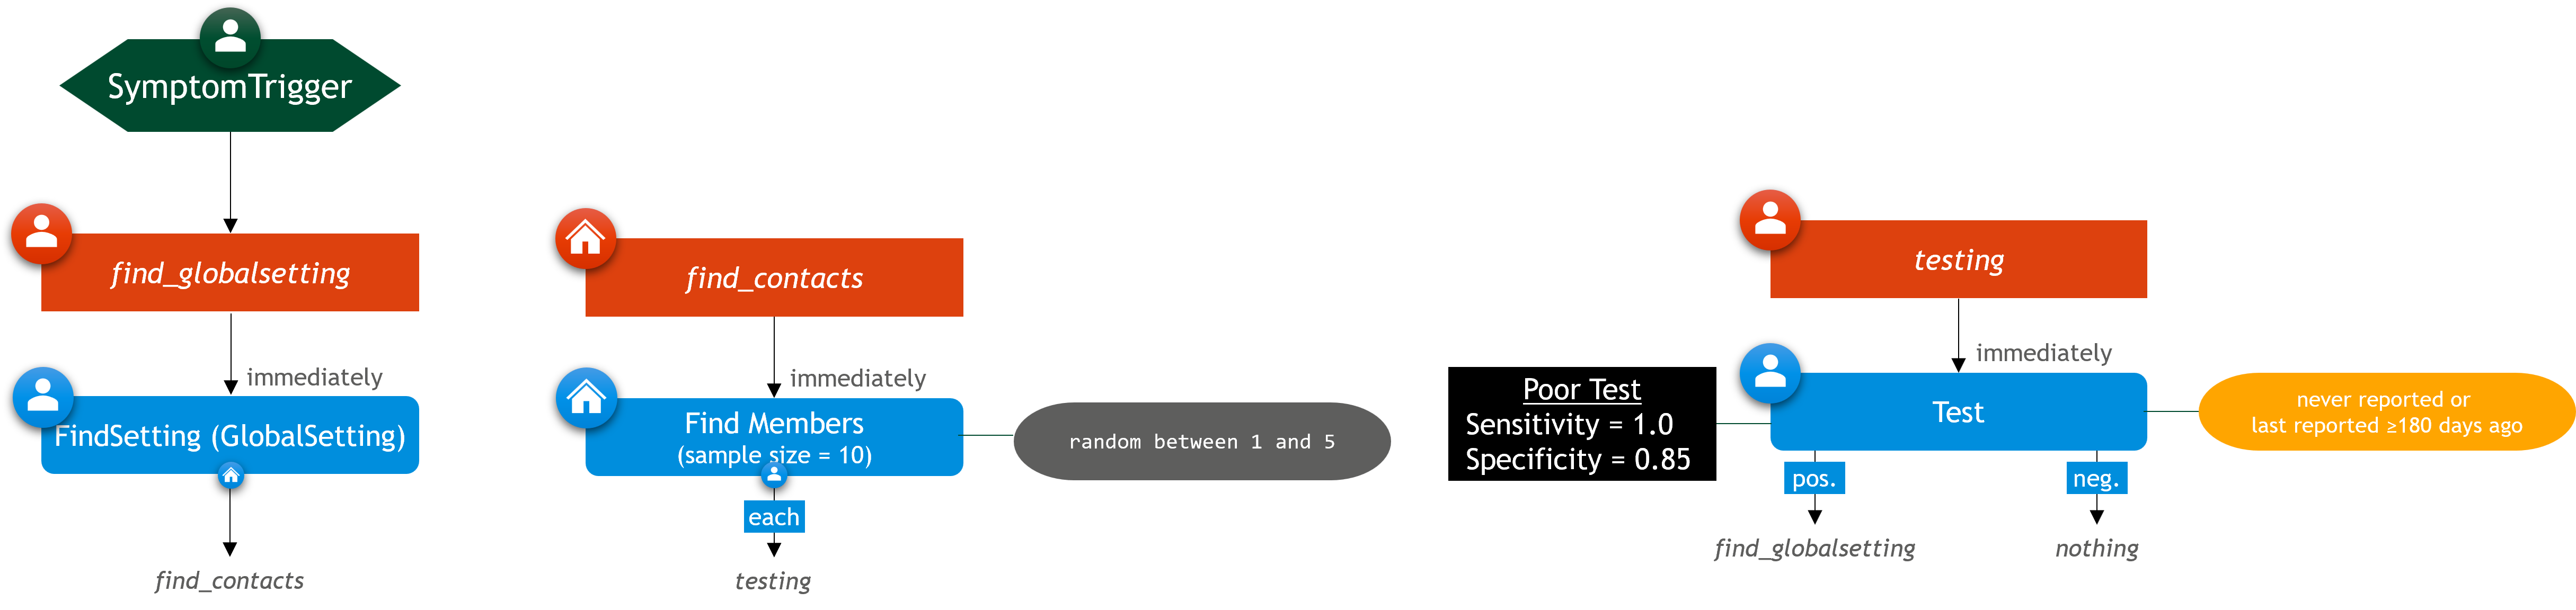
- No transmissions, only the initial 100 infections are actually ill
- Upon experiencing symptoms, we select 10 random individuals from the global setting with a 1-5 day delay
- Each individual will be subjected to a 85%-specificity test
- A positive test result will again cause the sampling of 10 random "contacts"
using GEMS

# simulation with no transmissions and switched on global setting
sim = Simulation(transmission_rate = 0.0, global_setting = true)
# strategy definitions
find_globalsetting = IStrategy("find setting", sim)
find_contacts = SStrategy("find contacts", sim)
testing = IStrategy("testing", sim)
# test with 85% specificity
poor_test = TestType("Poor Test", pathogen(sim), sim, specificity = 0.85)
# identify global setting
add_measure!(find_globalsetting, FindSetting(GlobalSetting, find_contacts))
# sample 10 contacts from global setting with 1-5 day delay
add_measure!(find_contacts,
    FindMembers(testing, sample_size = 10), delay = x -> rand(1:5))
# test individual if unreported or last report more than 6 months old
# run "contact tracing" for positive test results
add_measure!(testing,
    Test("poor-test", poor_test, positive_followup = find_globalsetting),
    condition = i -> (last_reported_at(i) <= 0 || tick(sim) - last_reported_at(i) >= 180))

trigger = SymptomTrigger(find_globalsetting)
add_symptom_trigger!(sim, trigger)

run!(sim)
rd = ResultData(sim)
gemsplot(rd,
    type = (:CompartmentFill, :EffectiveReproduction, :DetectedCases),
    legend = :topright)
Plot
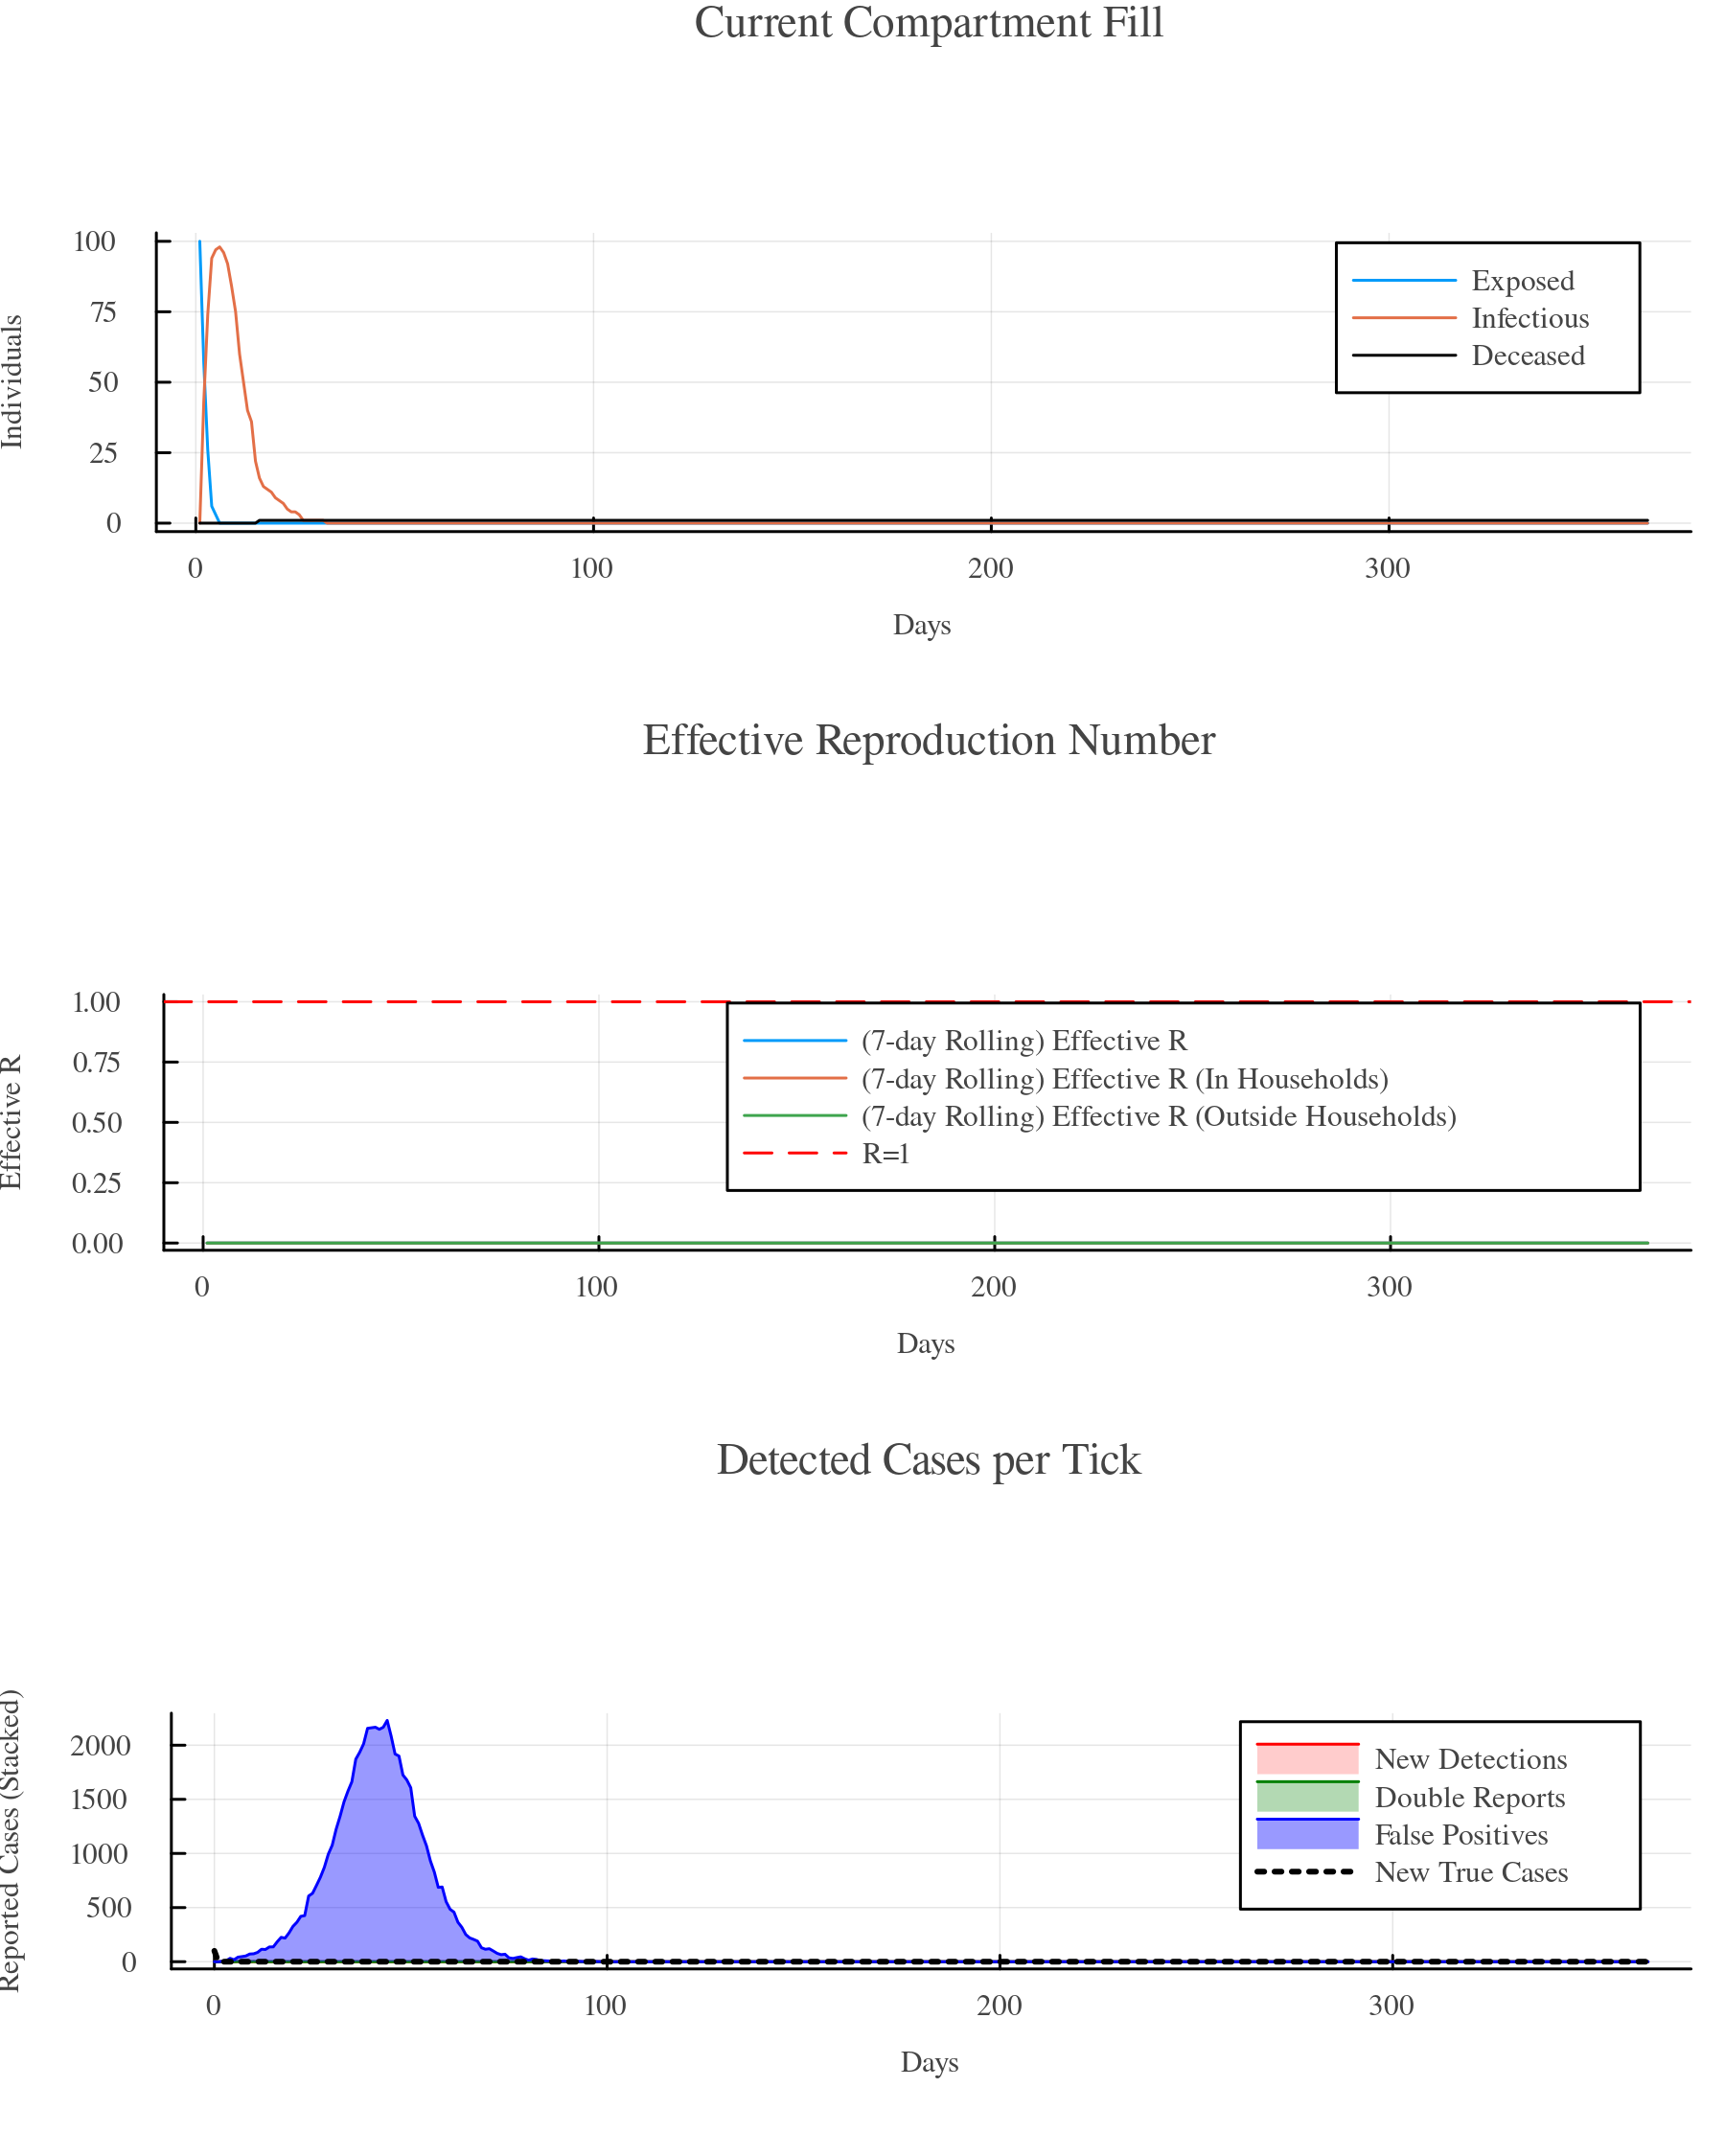
The results show that except for the initial 100 infections, no transmission dynamics are present in the simulation. The effective reproduction number is constantly at zero. However, we see an exponential growth in "detected cases" that mimics an epidemic curve and at some point detects more than 2% of the overall individuals as new infections each day although 100% of the "detection" are false positives.
Varying Test Sensitivity (or Specificity)
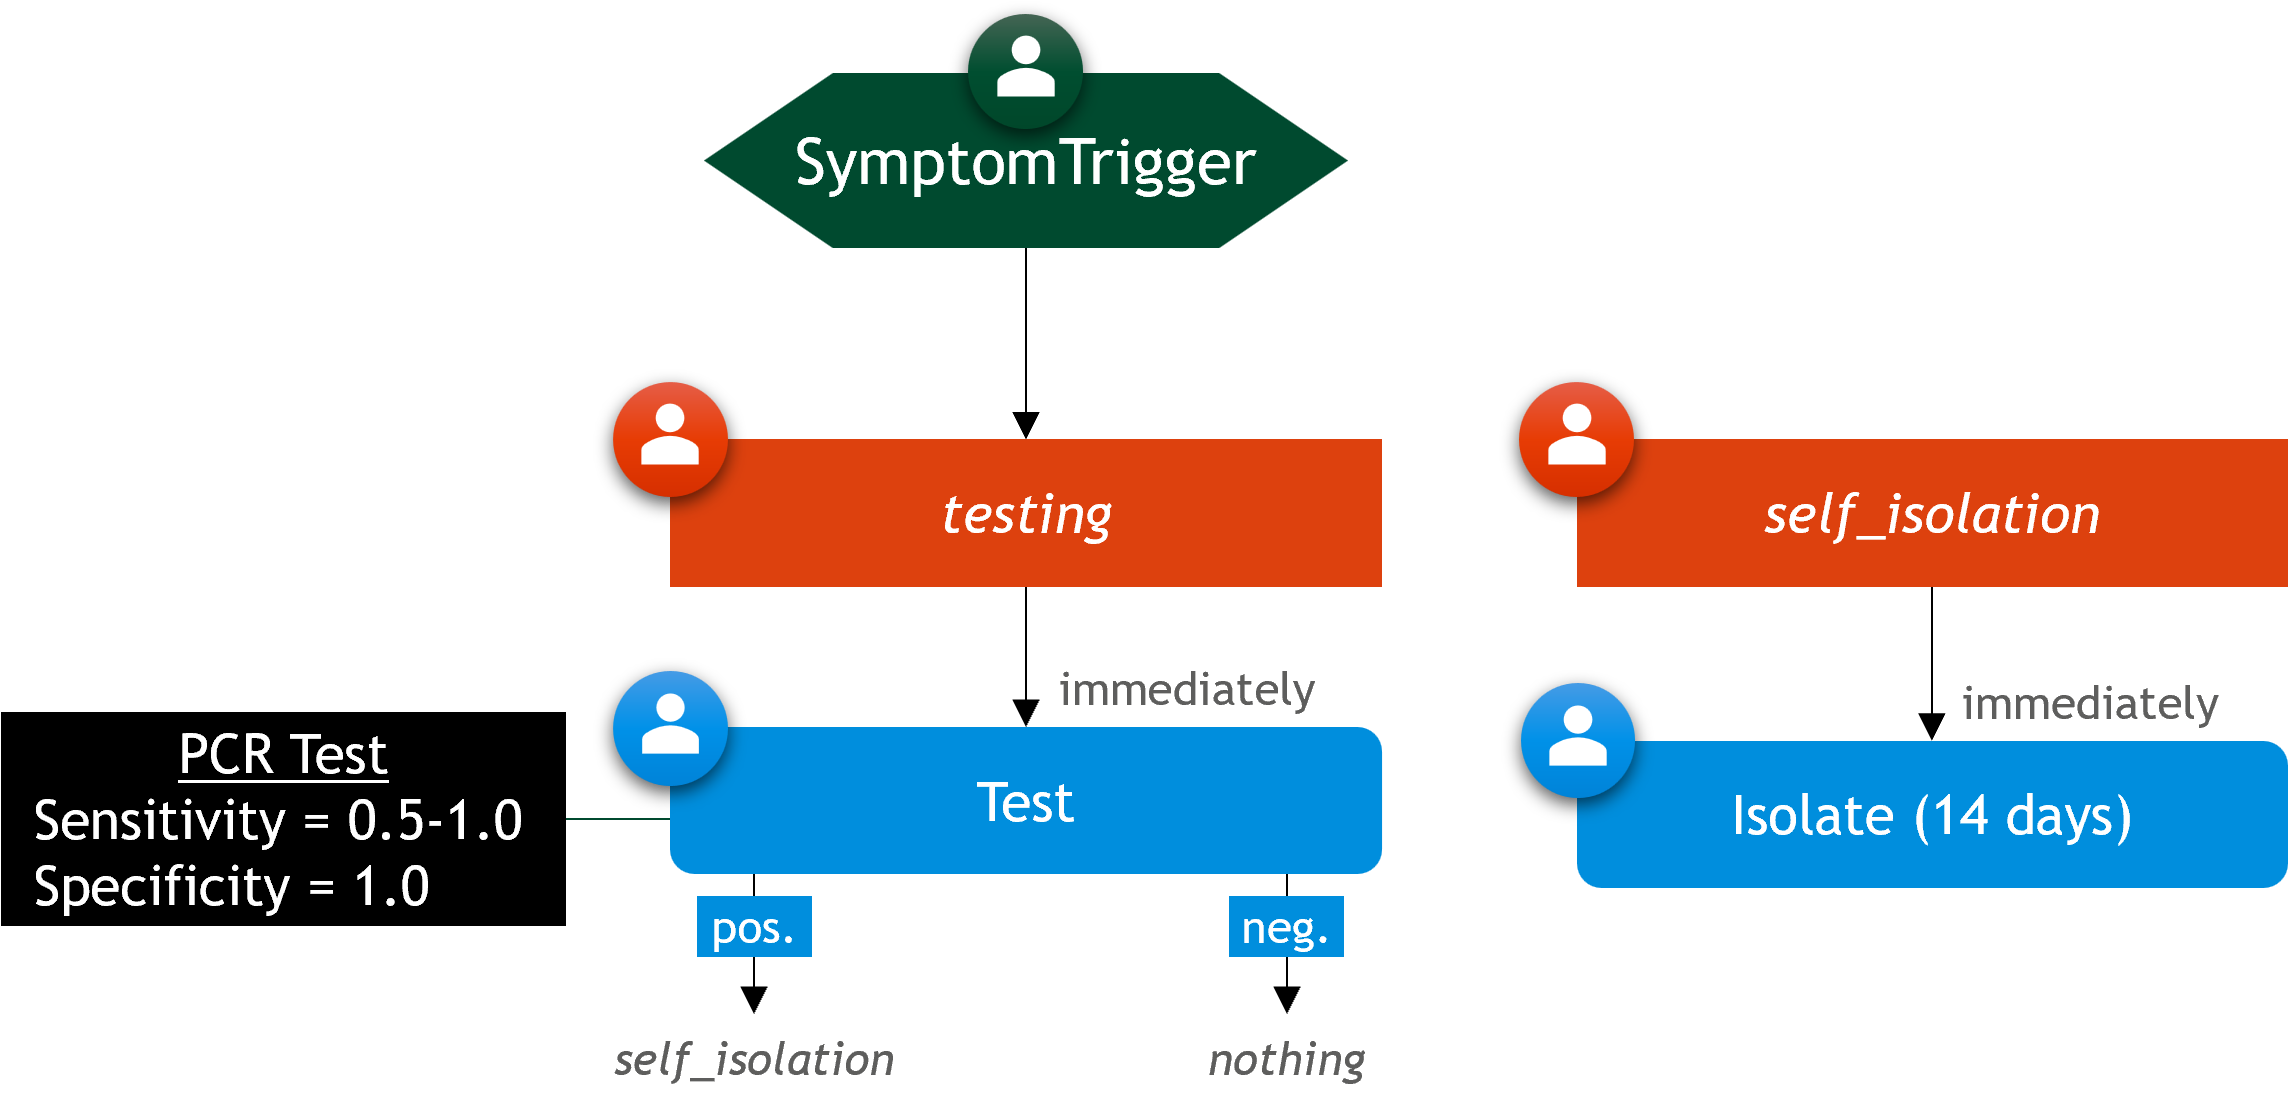
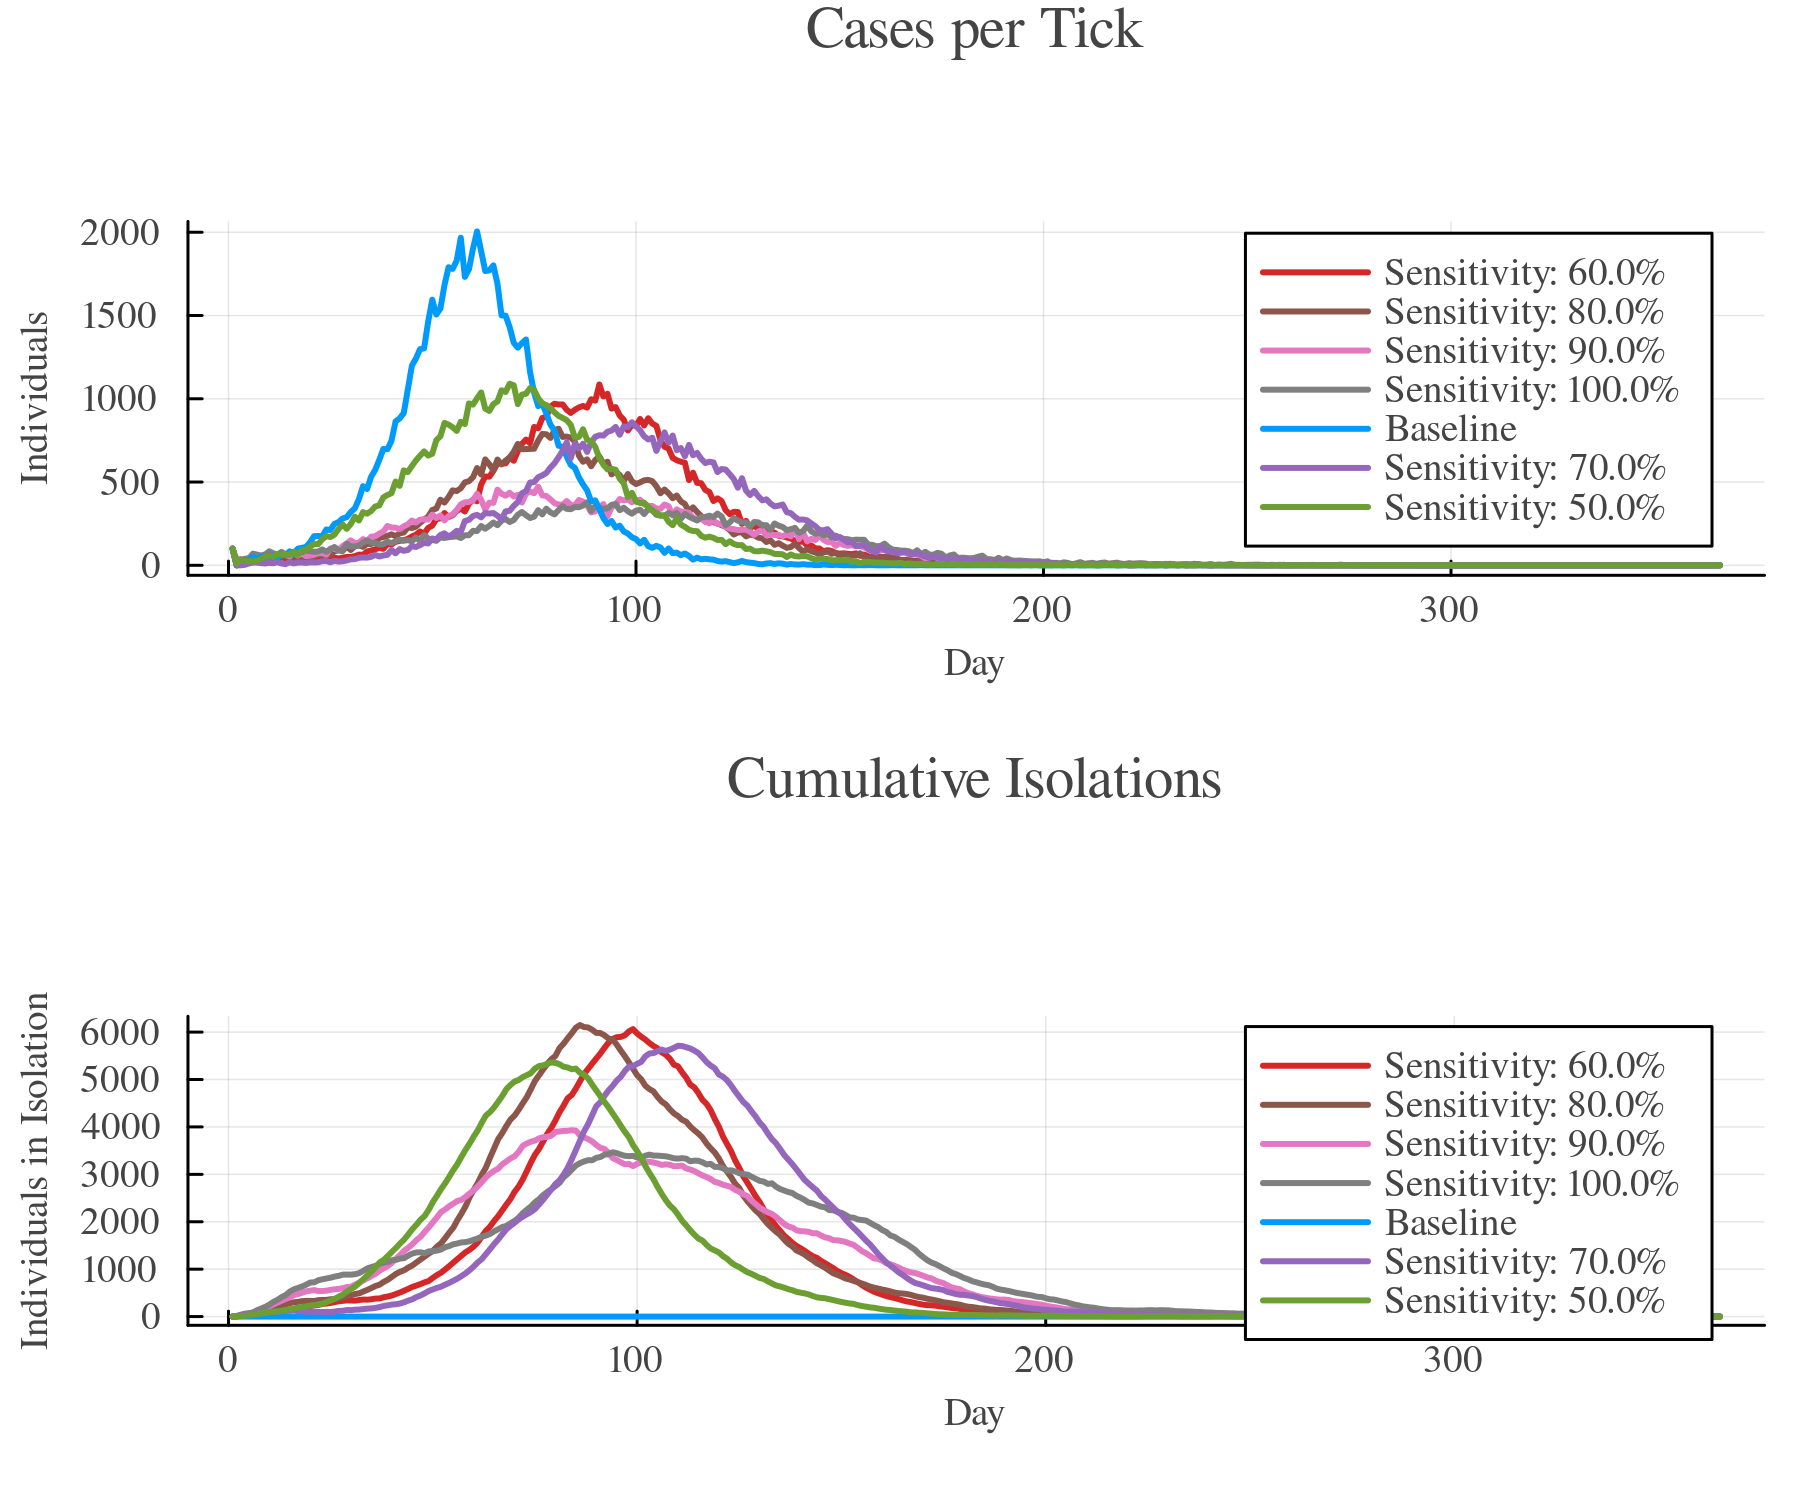
Here's an example of how you can vary intervention-related parameter such as the sensitivity of a test and inspect their influence on the overall dynamics. The code below defines what we call a "scenario-function" (testing_scenario!()). It takes the Simulation object and a sensitivity argument to parameterize the test. That way, it is much easier to set up multiple intervention scenarios with varying parameters. Moreover, the example uses the Batch functionality to easily aggregate all simulations and facilitate the execution and post-processing.
using GEMS

# to facilitate parameterization, set up a function
# that adds a scenario to a simulation object
function testing_scenario!(sim, sens)
    # define test type (PCR test) and pass sensitivity
    PCR_Test = TestType("PCR Test", pathogen(sim), sim, sensitivity = sens)
    # define self isolation strategy
    self_isolation = IStrategy("Self Isolation", sim)
    add_measure!(self_isolation, SelfIsolation(14))
    # define testing strategy that triggers self isolation
    testing = IStrategy("Testing", sim)
    add_measure!(testing, Test("Test", PCR_Test, positive_followup = self_isolation))

    trigger = SymptomTrigger(testing)
    add_symptom_trigger!(sim, trigger)
end

# use batch functionality to compare results
sims = Simulation[]
push!(sims, Simulation(label = "Baseline"))

# add scenarios with varying test sensitivities between 50% and 100%
for i in 0.5:0.1:1.0
    s = Simulation(label = "Sensitivity: $(100 * i)%")
    testing_scenario!(s, i)
    push!(sims, s)
end

b = Batch(sims...)
run!(b)
rd = ResultData(b)

gemsplot(rd, type = (:TickCases, :CumulativeIsolations), legend = :topright)
Plot
Limited Capacity (Testing)
In public health practice, working with limited resource capacities is often a challenging factor. This example demonstrates the impact of a capacity limit (regarding tests) on the overall observed progression. We compare two scenarios in which symptomatic individuals are tested (no other intervention applied). However, in the second scenario, only 50 tests can be applied per day.
Scenario Summary:
- 15% transmission rate (to spread out the curve)
- Symptomatic individuals are tested in both scenarios
- No further interventions apply
- In the second scenarios, only the first 50 symptomatic individuals per day are tested
using GEMS, Plots

# BASELINE: simulation with unlimited testing capacity
baseline = Simulation(label = "Unlimited Testing", transmission_rate = 0.15)
PCR_Test_b = TestType("PCR Test", pathogen(baseline), baseline)
testing_b = IStrategy("Testing", baseline)
add_measure!(testing_b, Test("Test", PCR_Test_b))
trigger_b = SymptomTrigger(testing_b)
add_symptom_trigger!(baseline, trigger_b)

# helper struct to count daily tests
mutable struct TestCounter
    tick
    count
end

# helper function to add up daily tests
# returns true until test capacity for the day (50) is used up
function test_available!(sim, tc)
    if tick(sim) > tc.tick
        tc.tick = tick(sim)
        tc.count = 1
    else
        tc.count += 1
    end
    tc.count < 50 ? true : false
end

# SCENARIO: simulation with 50 tests per day
tc = TestCounter(0,0) # test counter (tick, tests)
scenario = Simulation(label = "Limited Testing Capacity", transmission_rate = 0.15)
PCR_Test_s = TestType("PCR Test", pathogen(scenario), scenario)
testing_s = IStrategy("Testing", scenario)
add_measure!(testing_s, Test("Test", PCR_Test_s),
    condition = i -> test_available!(scenario, tc)) # condition "adds up" daily tests
trigger_s = SymptomTrigger(testing_s)
add_symptom_trigger!(scenario, trigger_s)

run!(baseline)
run!(scenario)

rd_b = ResultData(baseline)
rd_s = ResultData(scenario)

gemsplot([rd_b, rd_s],
    type = (:TickCases, :EffectiveReproduction, :ObservedReproduction, :ActiveDarkFigure),
    size = (1000, 1200))
Plot
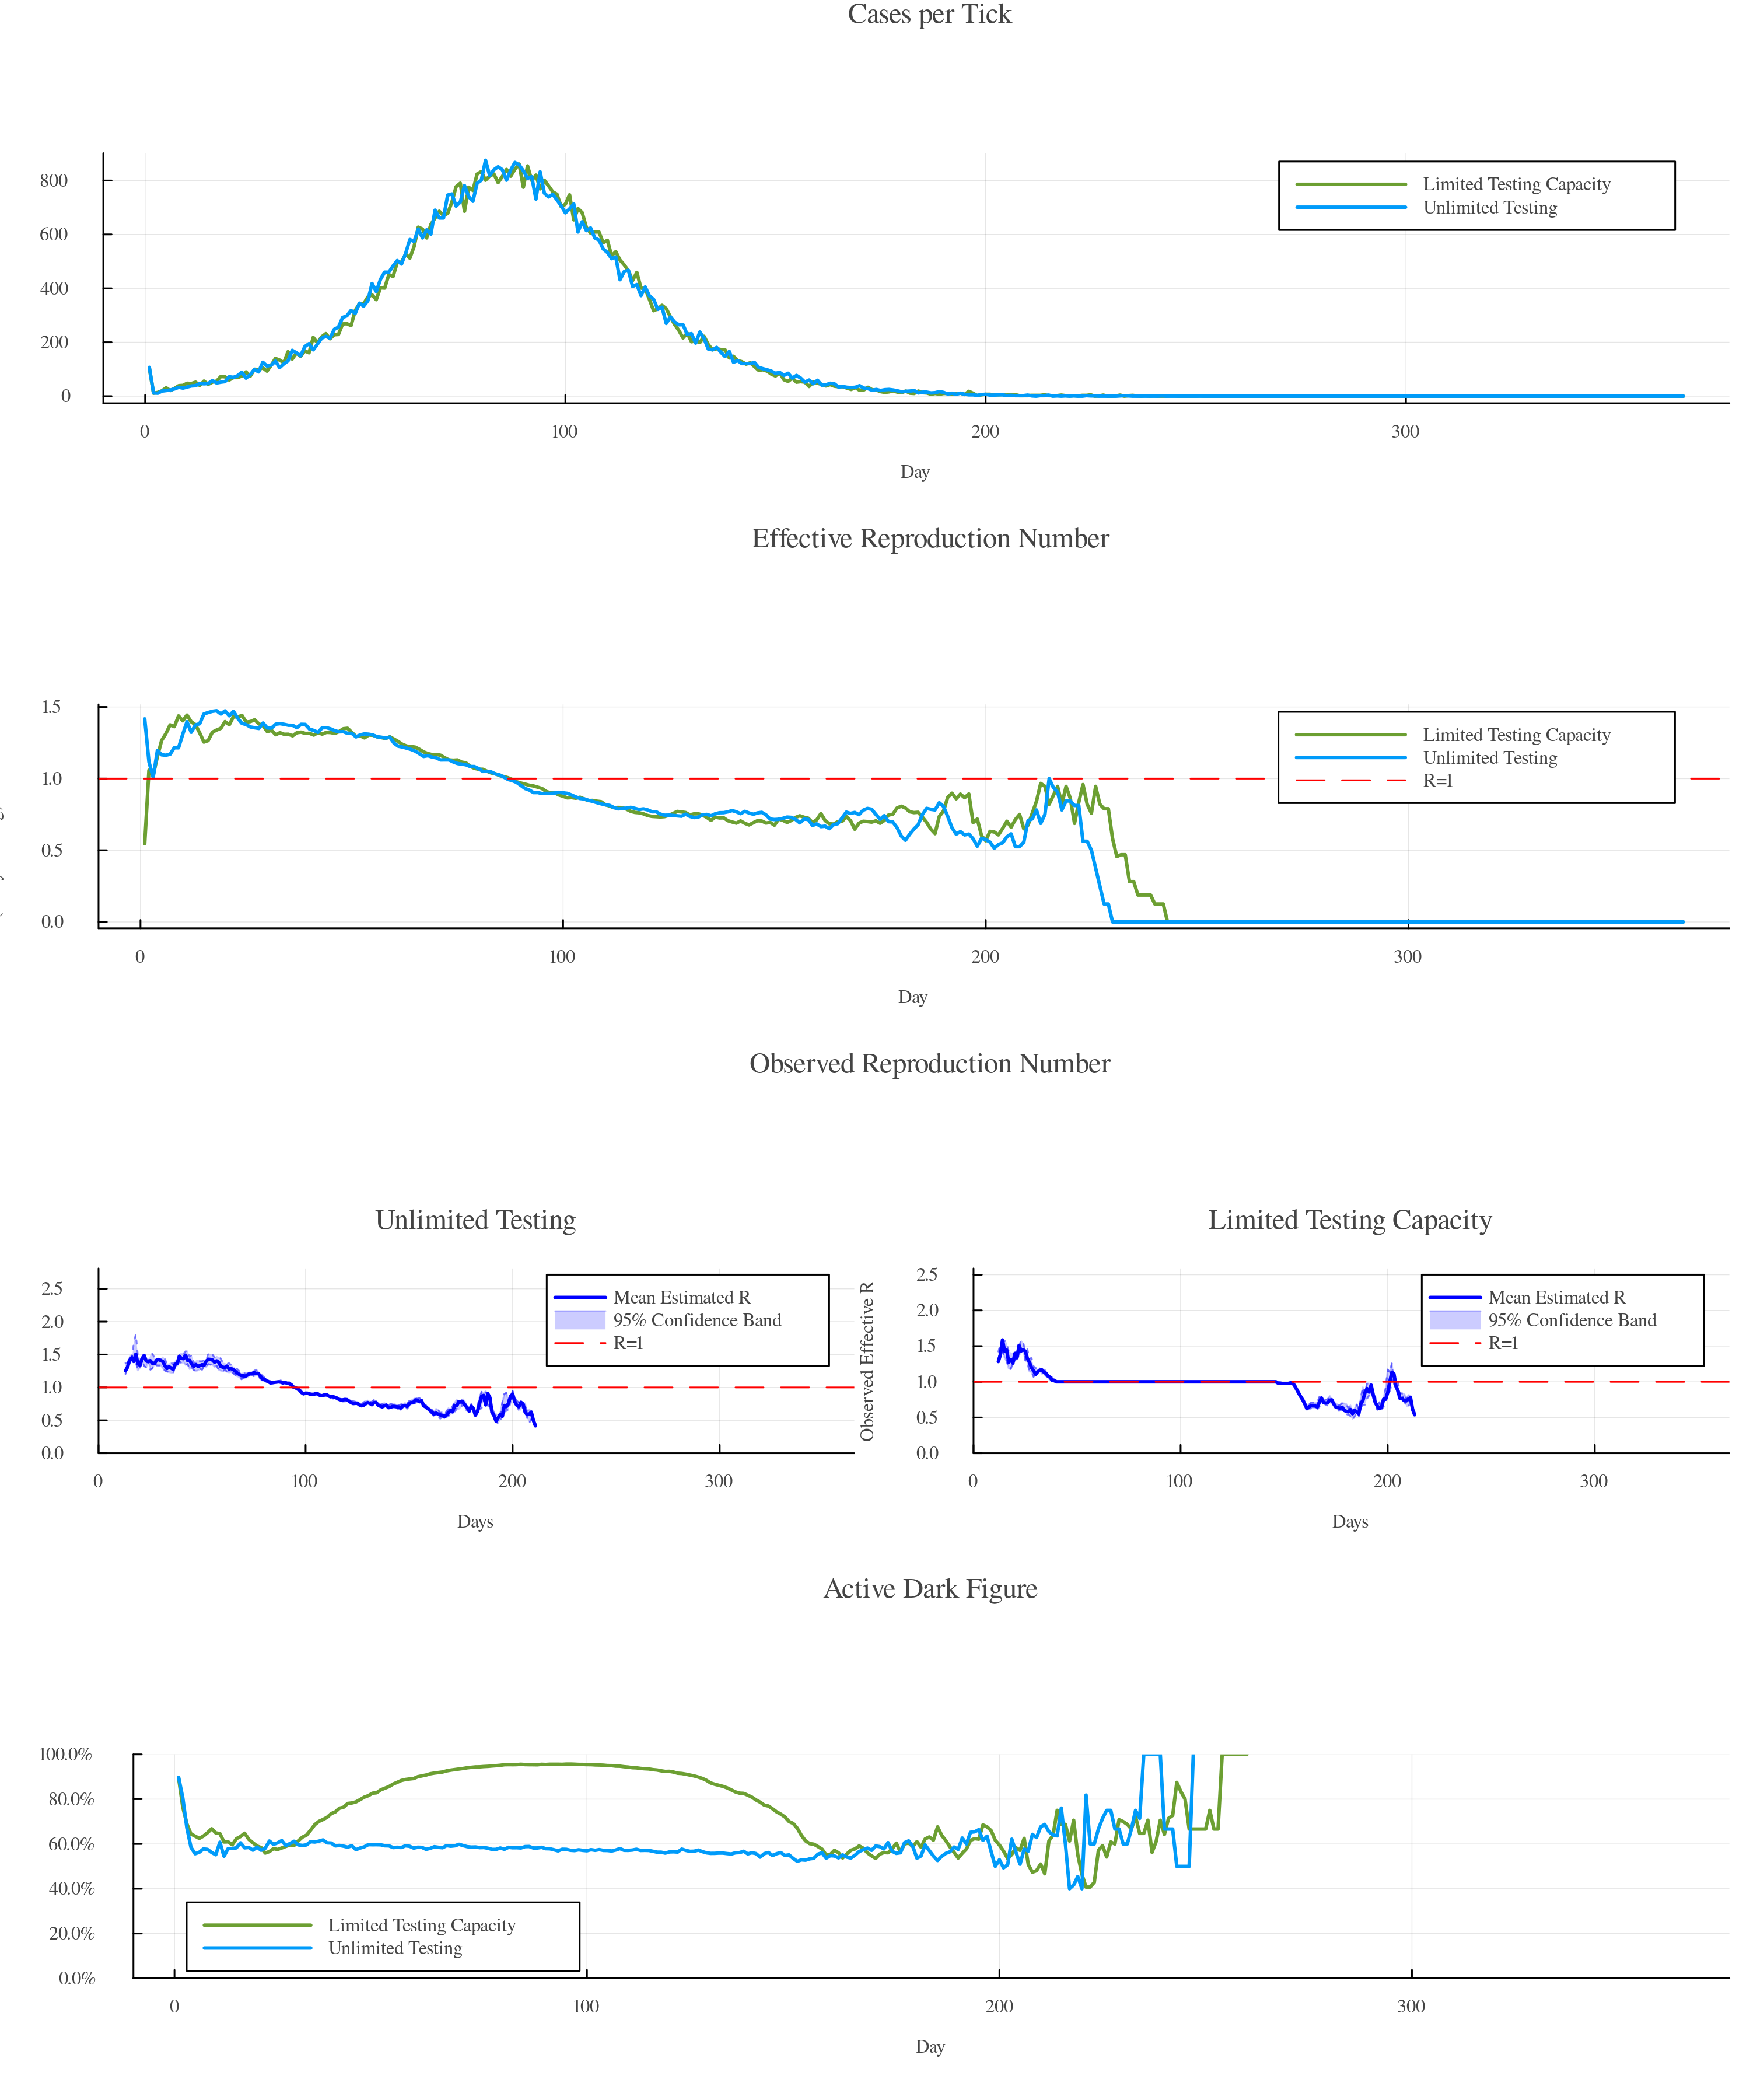
We see that both simulations have a very similar true infection- and effective reproduction number curves. The observed reproduction number, however, differs significantly once the daily-testing threshold of 50 cases is reached. In the second scenario, the observed reproduction number is constantly at exactly 1, suggesting that the growth of the epidemic is linear instead of exponential. This is due to the fact that we get the limited 50 positive tests each day, every day. The active dark figure reveals that once the threshold is reached, the number of undetected cases suddenly spikes. While this example considers capacity limits with regard to testing, you can apply the same mechanics to other capacity-constrained measures such as contact-tracing or vaccination.
Pool Testing
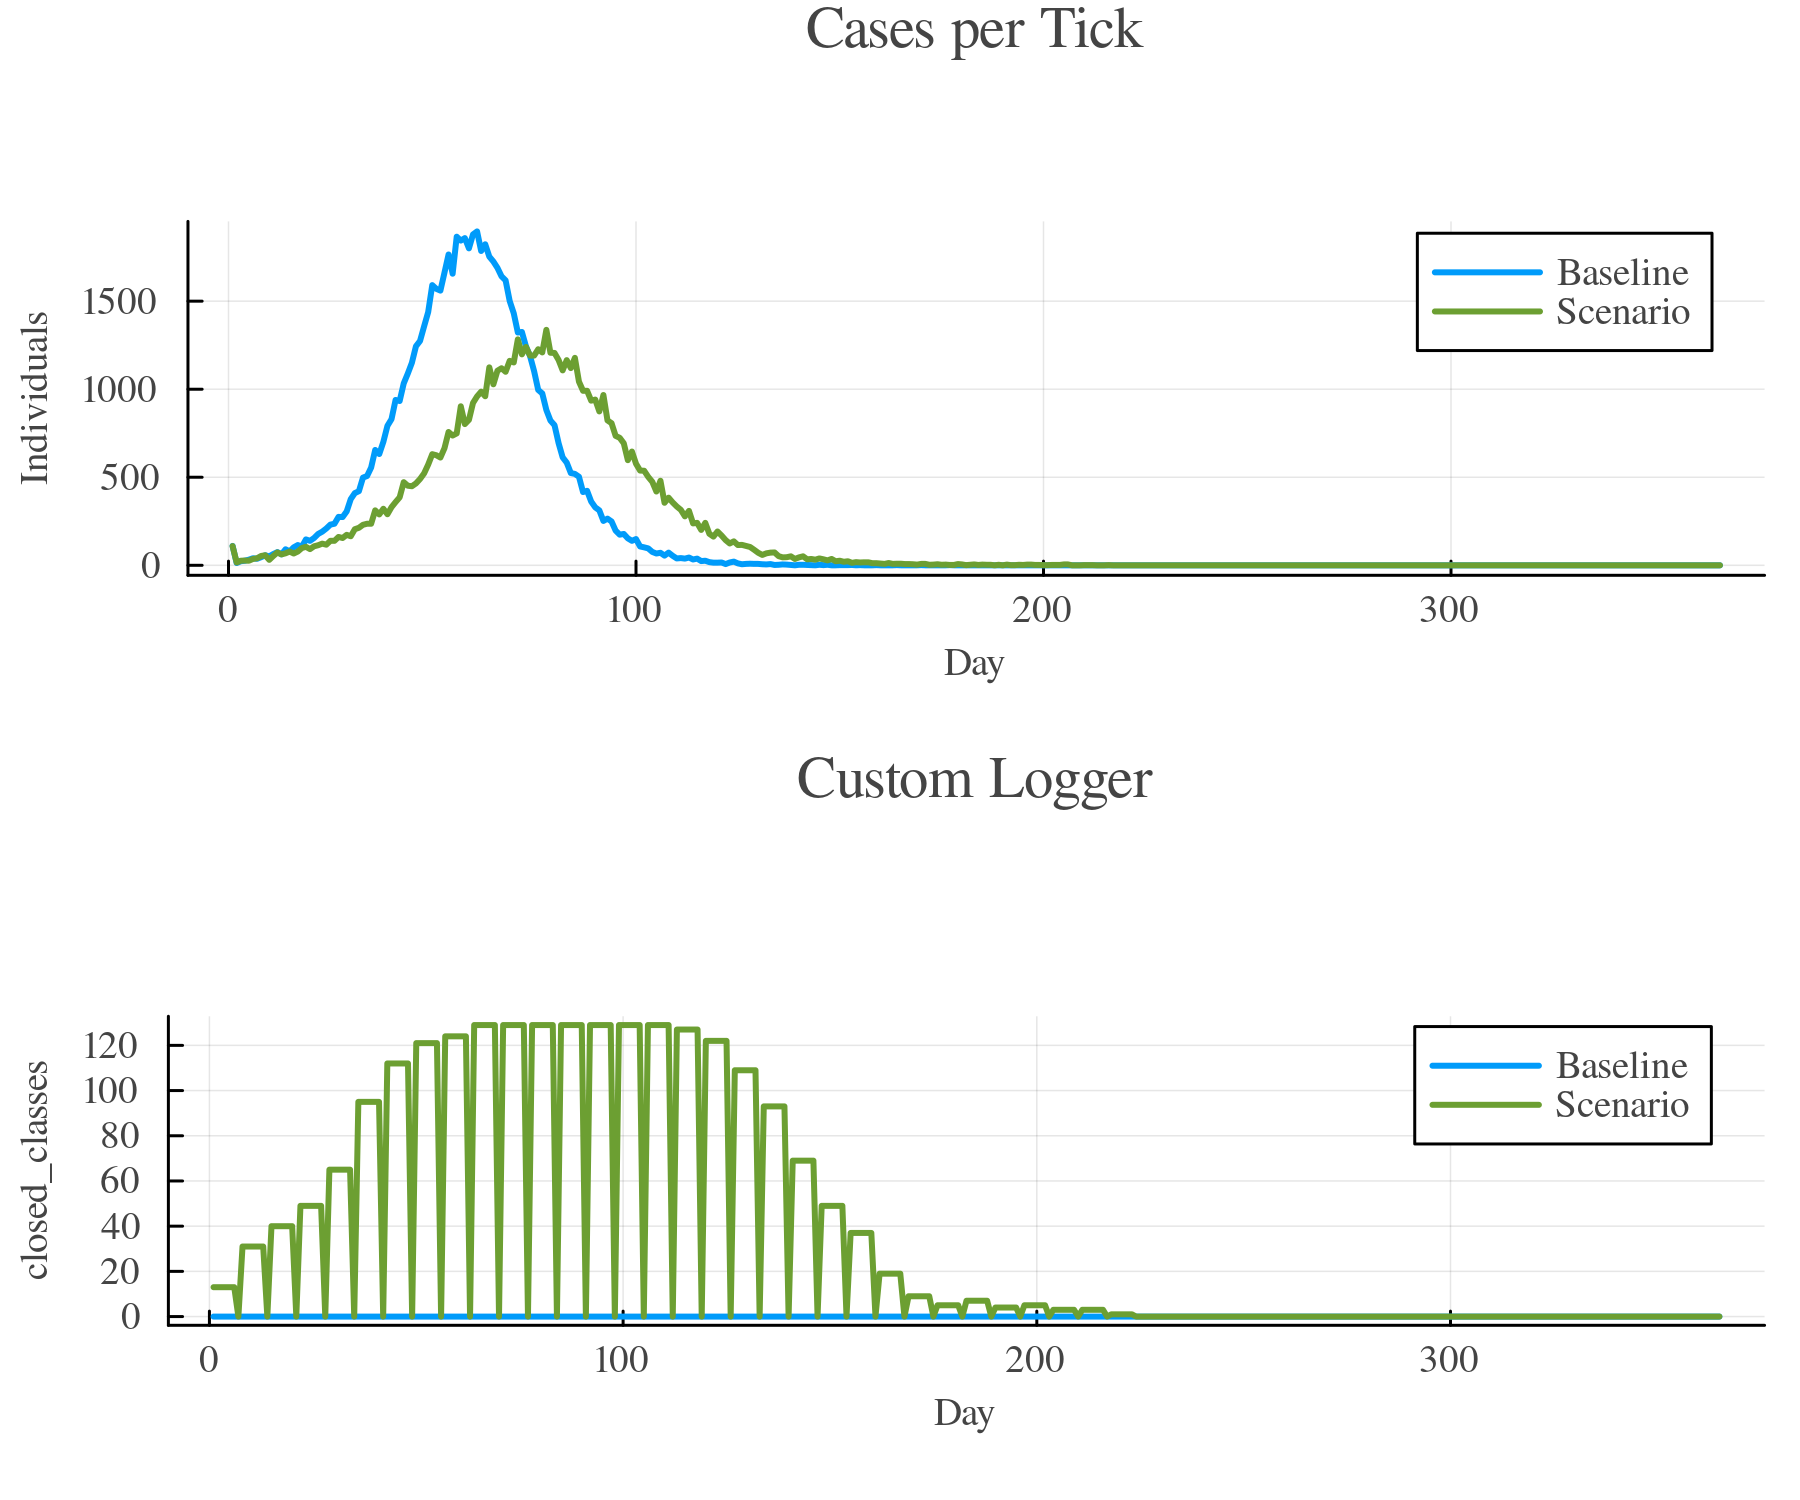
Besides individual testing, GEMS also offers the option to perform so-called "pool tests". Such tests return a positive result if at least one individual in a given setting is infected. Working with pool tests is very similar to other testing scenarios with the main difference being, that pool tests are applied to settings, not to individuals. Consequently, a positive pool test does not provide any information about whom of the individuals is infected. The example below tests all school classes every seven days and closes the class for the following week if the pool test result is positive. We furthermore add a CustomLogger to track the number of currently closed school classes.
Scenario Summary:
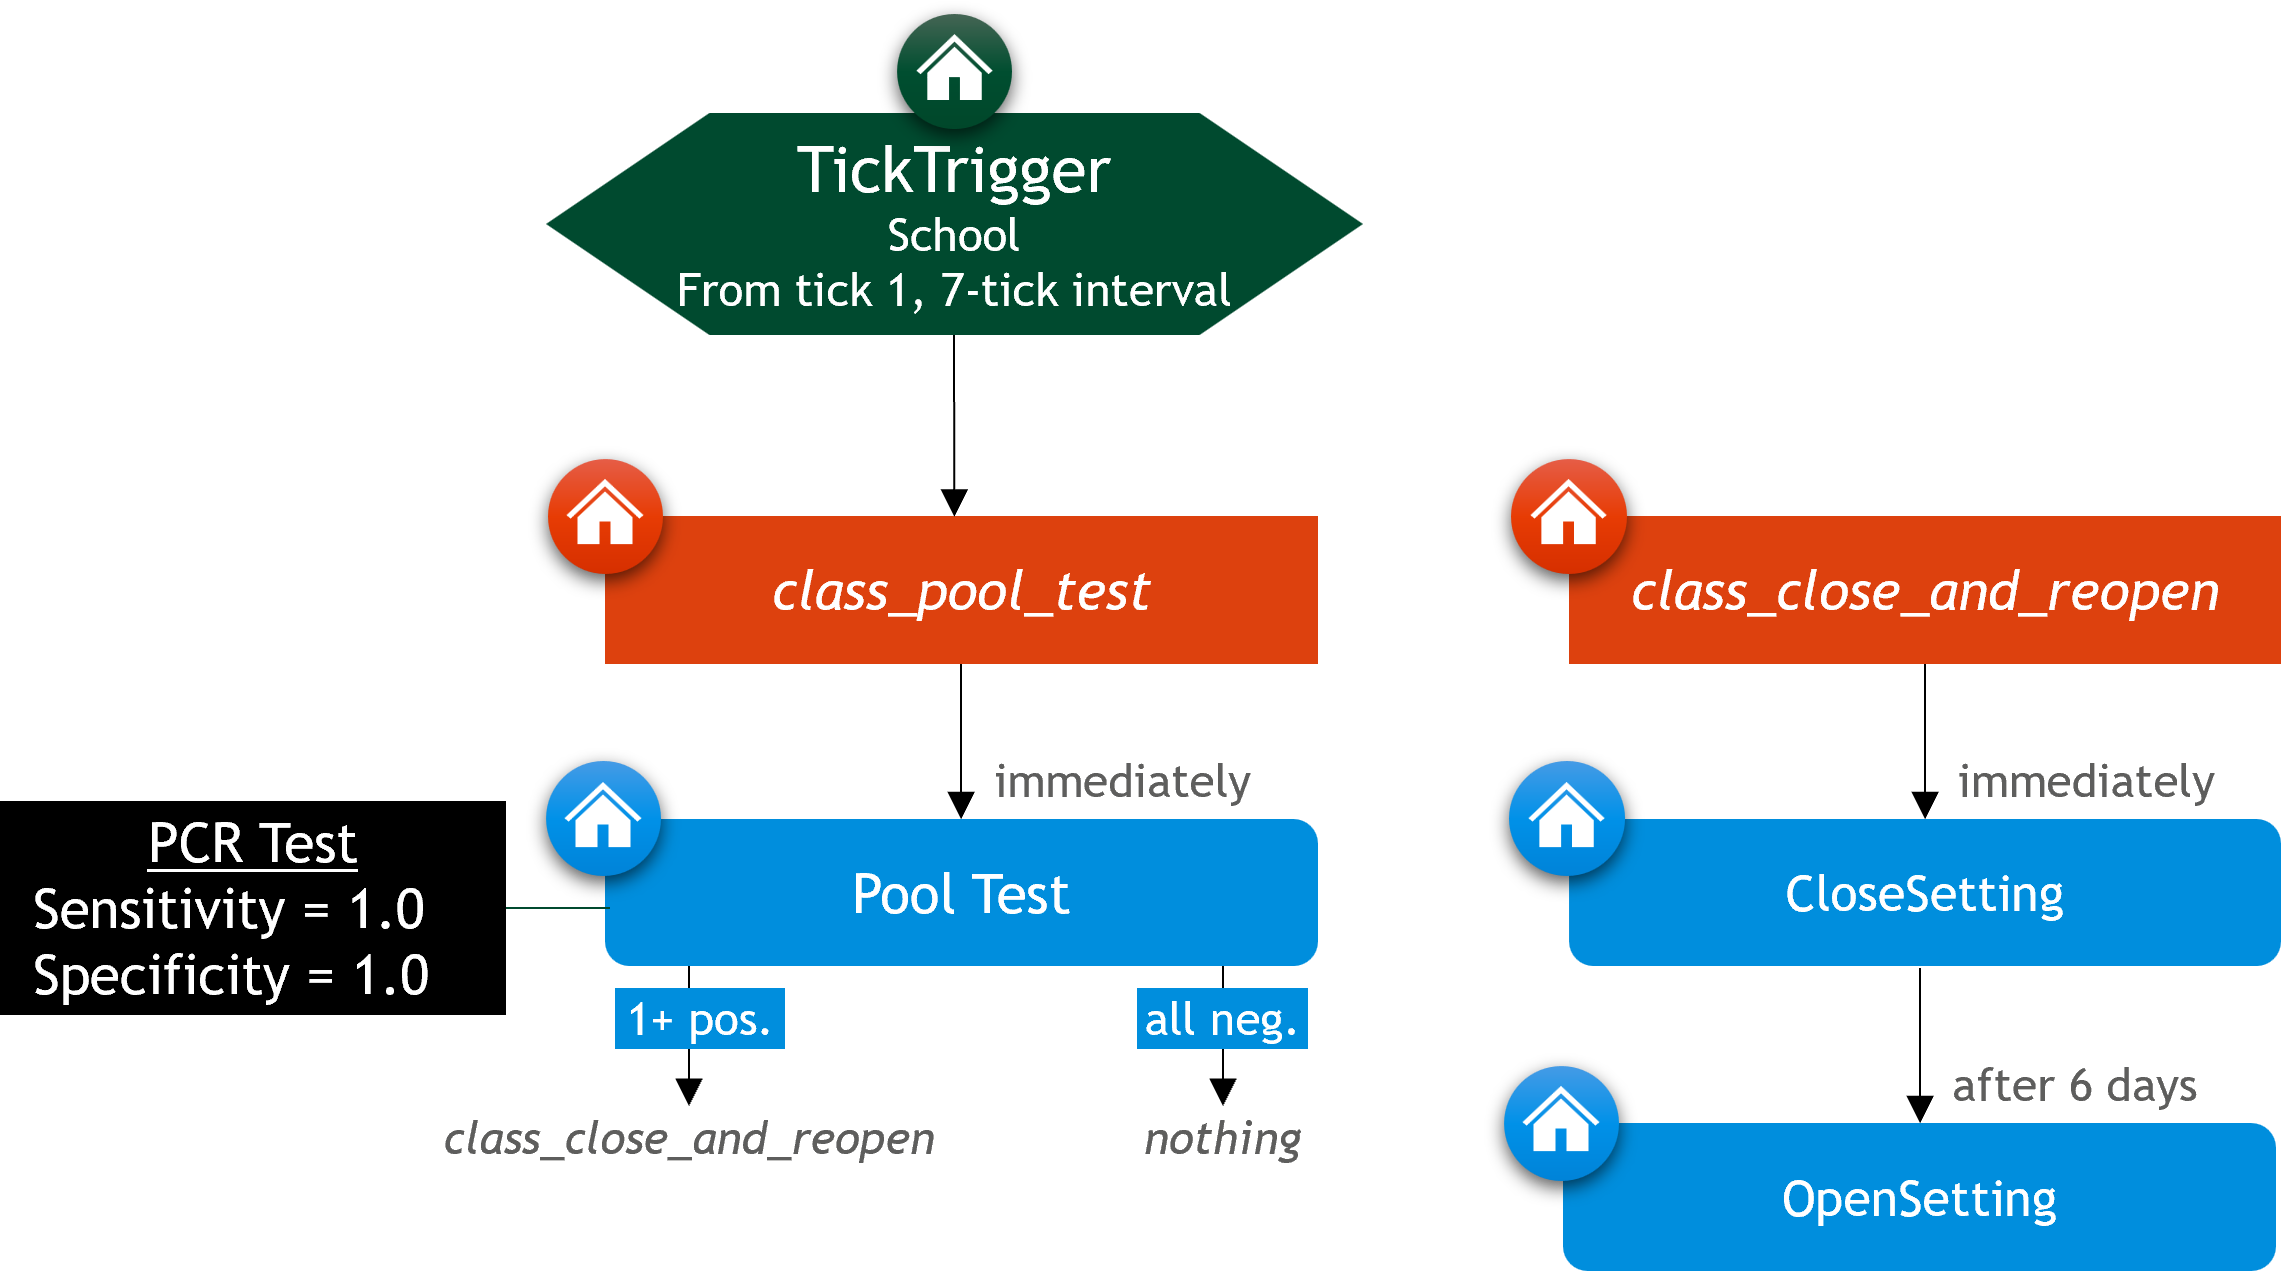
- Pool-testing every school class once a week
- If test is positive, school class is closed for the week
using GEMS
# simulation without interventions
baseline = Simulation(label = "Baseline")

self_isolation = IStrategy("Self Isolation", scenario_1)
add_measure!(self_isolation, SelfIsolation(14))
trigger = SymptomTrigger(self_isolation)
add_symptom_trigger!(scenario_1, trigger)

# simulation with school class closure for 7 days if pool test positive
scenario = Simulation(label = "Scenario")
# define test type (PCR test)
PCR_Test = TestType("PCR Test", pathogen(scenario), scenario)
# strategy that closes classes for the next 6 days
class_close_and_reopen = SStrategy("Class Close and Reopen", scenario)
add_measure!(class_close_and_reopen, CloseSetting())
add_measure!(class_close_and_reopen, OpenSetting(), offset = 6)
# strategy that tests whether at least one infected individual is in class
class_pool_test = SStrategy("Class Monday Pool Testing", scenario)
add_measure!(class_pool_test, PoolTest("monday_pool_testing", PCR_Test,
    positive_followup = class_close_and_reopen))
# add trigger that is being fired every 7 days for each school class
stt = STickTrigger(SchoolClass, class_pool_test, interval = Int16(7))
add_tick_trigger!(scenario, stt)

b = Batch(baseline, scenario)

# add logger to track number of currently closed school classes
cl = CustomLogger(closed_classes = sim -> sum(.!is_open.(schoolclasses(sim))))
customlogger!(b, cl)

run!(b)
rd = ResultData(b)

gemsplot(rd, type = (:TickCases, :CustomLoggerPlot))
Plot
Recurrent Testing
Let's consider an example where individuals can get tested multiple times. The code below compares two scenarios where individuals go into self-isolation for 10 days upon experiencing symptoms. In the second example, individuals can get tested after five days and leave isolation if the test is negative. With a positive test, individuals can get another test two days later. We neglect the fact that this will cause some tests to be performed on day 11.
Scenario Summary:
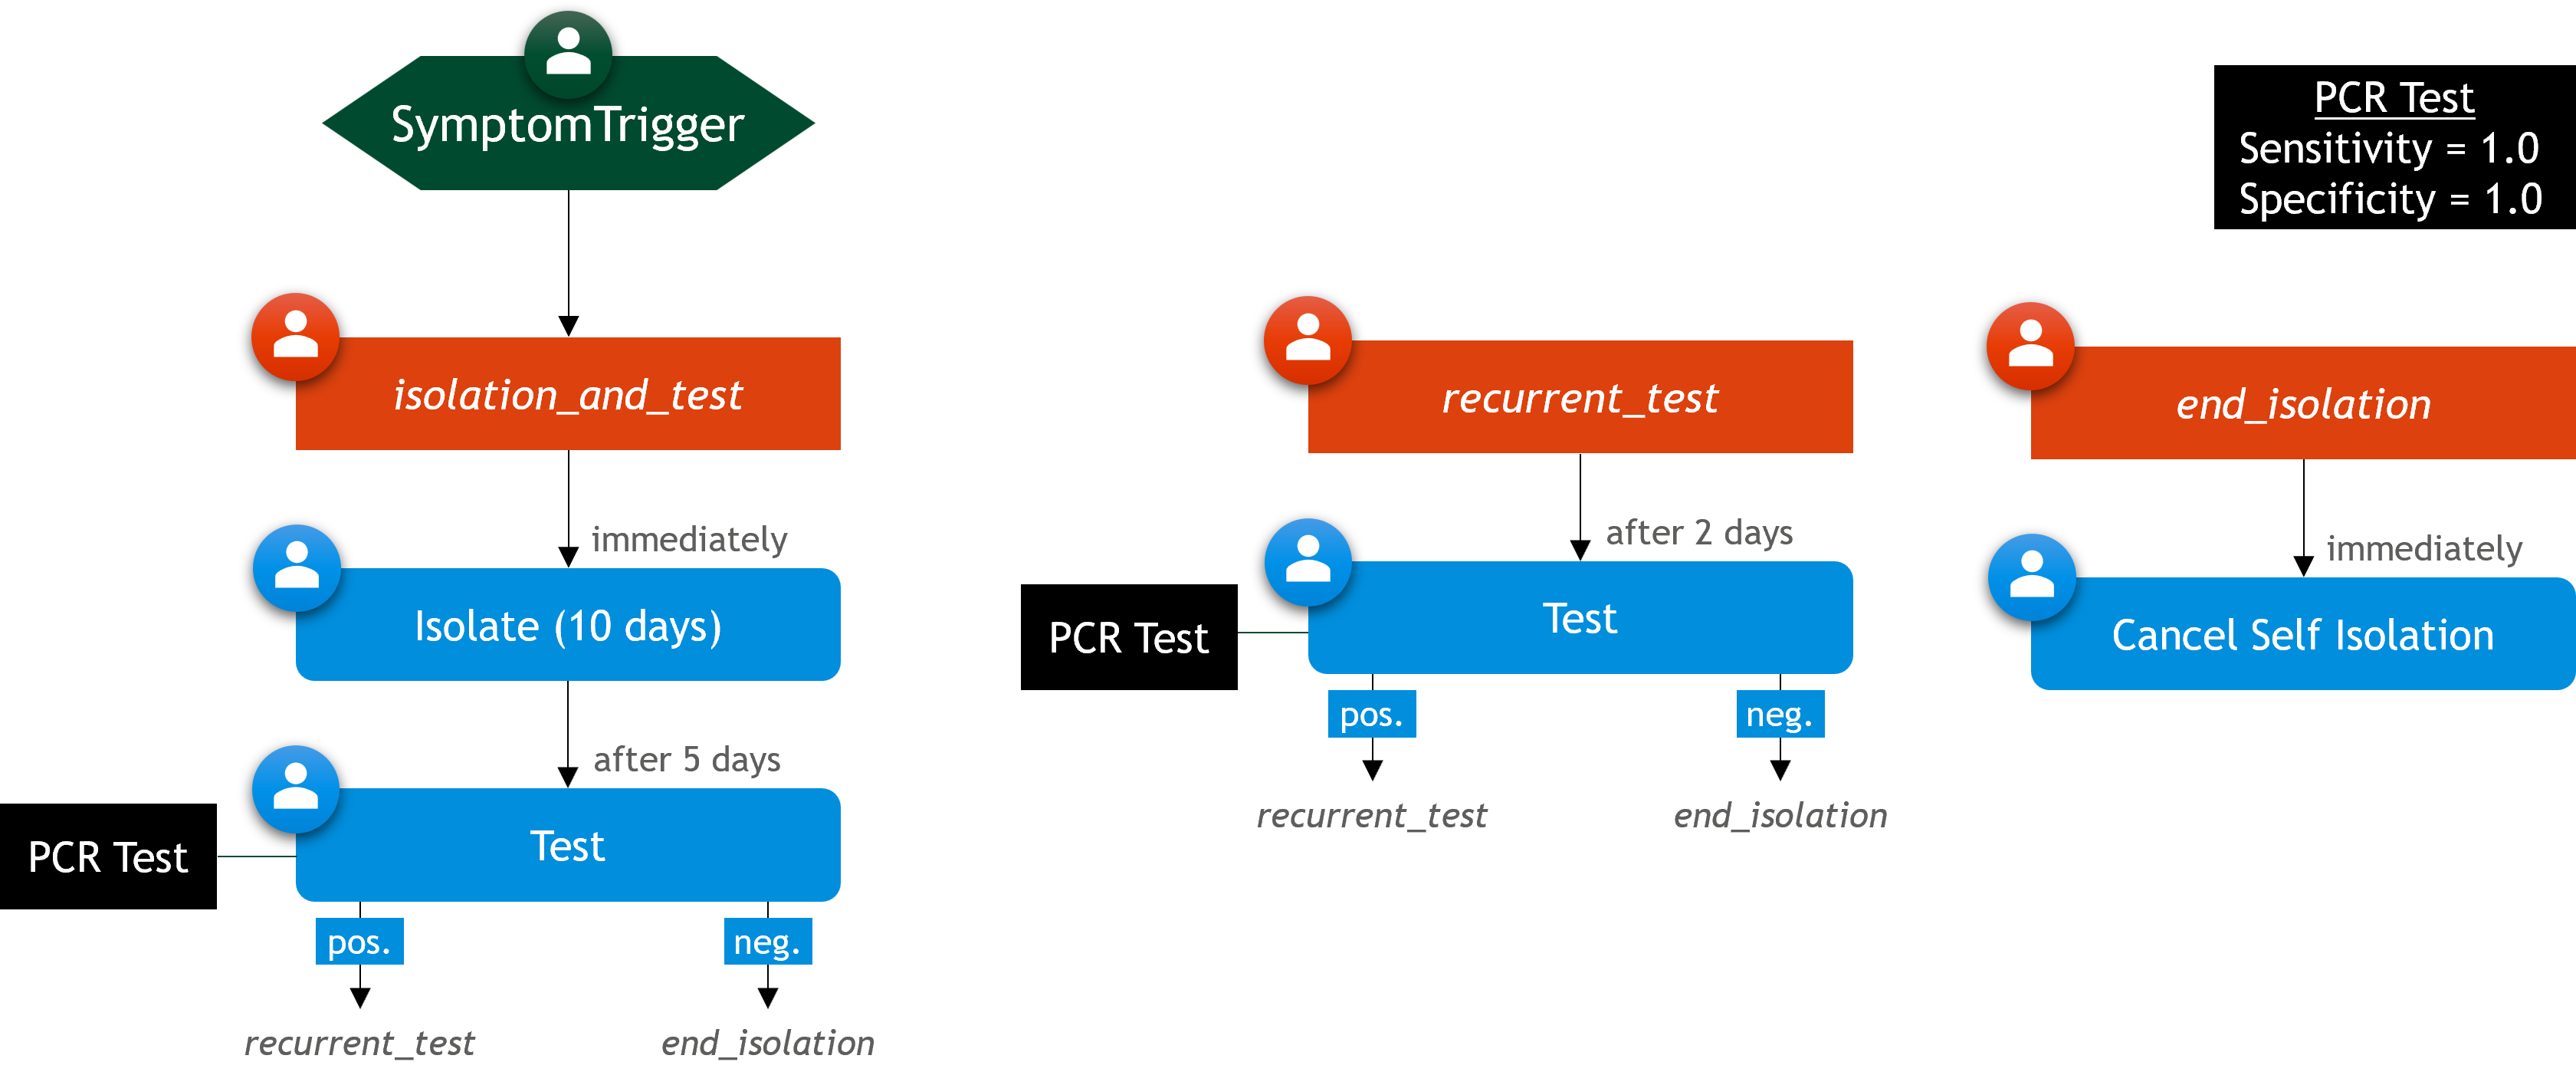
- A symptomatic individual goes into self-isolation for 10 days
- After day 5, they can get a test
- If the test is negative, the individual may leave isolation
- If the test is positive, the individual remains isolated and may test again after 48 hours
- Individuals will get tested in a two-day interval as long as they are infected
using GEMS

# SCENARIO 1: simulation with self-isolation only
scenario_1 = Simulation(label = "Isolation Only")
self_isolation = IStrategy("Self Isolation", scenario_1)
add_measure!(self_isolation, SelfIsolation(14))
trigger_1 = SymptomTrigger(self_isolation)
add_symptom_trigger!(scenario_1, trigger_1)

# SCENARIO 2: simulation with self-isolation and recurrent testing
scenario_2 = Simulation(label = "Recurrent Testing")
# define test type (PCR test)
PCR_test = TestType("PCR Test", pathogen(scenario_2), scenario_2)
# strategy that ends isolation
end_isolation = IStrategy("End Isolation", scenario_2)
add_measure!(end_isolation, CancelSelfIsolation())
# testing strategy that triggers itself after two days if positive
recurrent_test = IStrategy("Recurrent Testing", scenario_2)
add_measure!(recurrent_test,
    Test("Recurrent Test", PCR_test,
        positive_followup = recurrent_test,
        negative_followup = end_isolation),
    offset = 2)
# self-isolation and initial testing strategy
isolation_and_test = IStrategy("Self Isolation", scenario_2)
add_measure!(isolation_and_test, SelfIsolation(10))
add_measure!(isolation_and_test,
    Test("First Test", PCR_test,
        positive_followup = recurrent_test,
        negative_followup = end_isolation),
    offset = 5)
trigger_2 = SymptomTrigger(isolation_and_test)
add_symptom_trigger!(scenario_2, trigger_2)

b = Batch(scenario_1, scenario_2)
run!(b)
rd = ResultData(b)

gemsplot(rd, type = (:DetectedCases, :CumulativeIsolations))
Plot
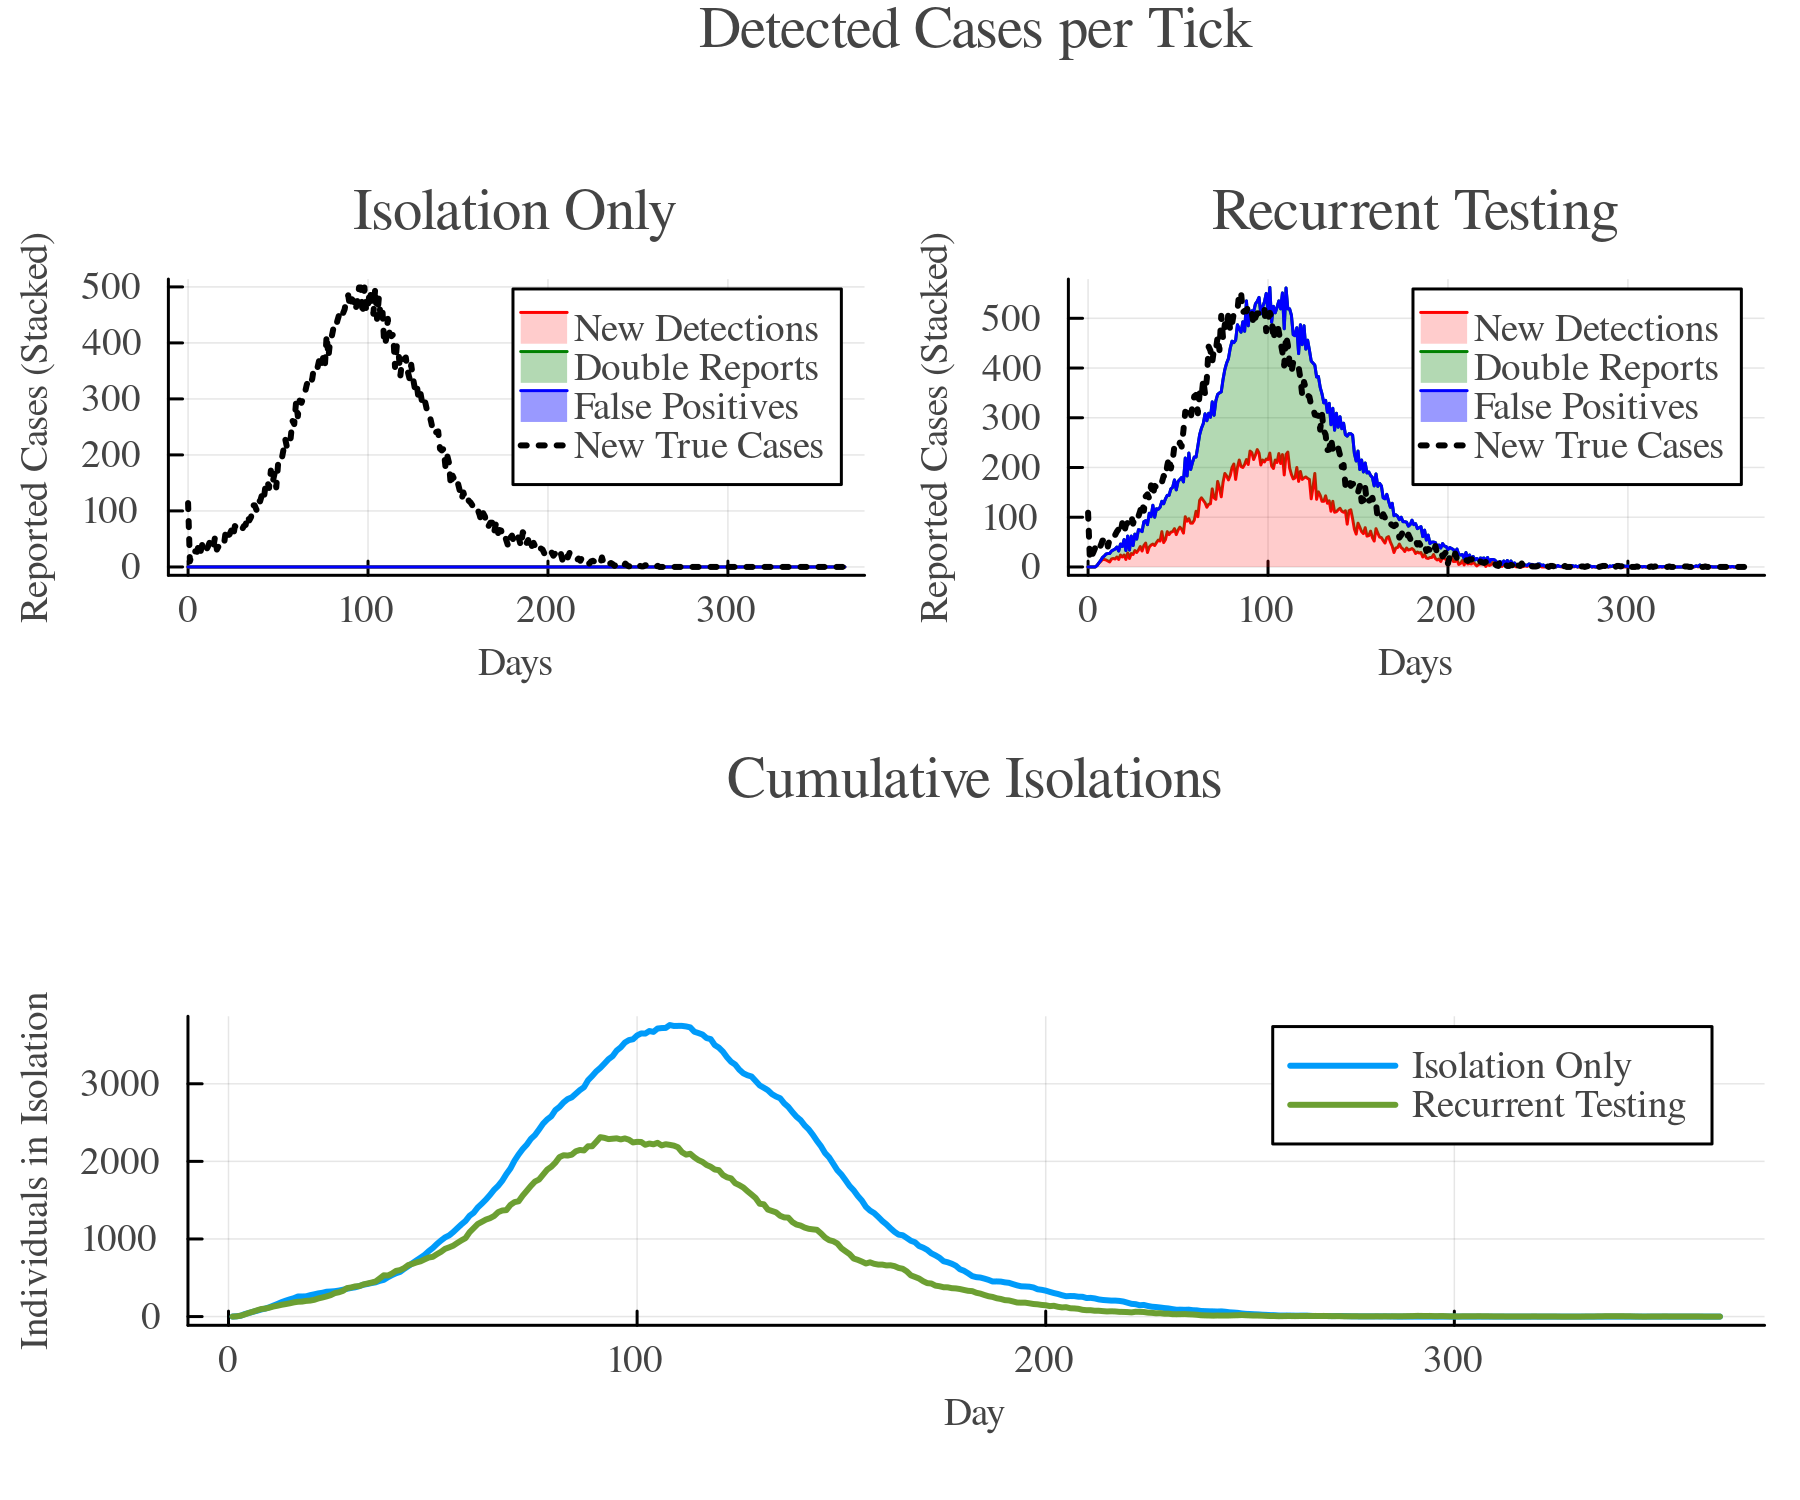
The results show that the overall case numbers are similar in both scenarios. The extensive testing can lower the person-days spent in isolation as not all individuals will stay in isolation for the full 10 days. However, as all positive tests lead to a reported new case, we observe a substantial number of double reports (green area in the "Detected Cases"-plot). The testing measure only tests an individual for a pathogen but cannot differentiate whether it is the same infection or not. It is possible to specify that a test should not lead to a new case being reported. Please look up the Test measure's parameterization options. The next tutorial considers two test types where one of them does not lead to a reported case (self-applied test).
Seroprevalence Testing
In this tutorial, we demonstrate how to integrate seroprevalence testing into a symptom-triggered isolation strategy for school classes using GEMS. This example builds on a similar idea used in the household isolation scenario but applies it to school classes. When a student develops symptoms, the rest of the class is isolated. However, we now use seroprevalence testing to avoid unnecessary isolations. Instead of automatically isolating all classmates, we test them for antibodies. Only students who do not have antibodies (i.e., test seronegative) are isolated. The assumption is that seropositive individuals are immune and therefore don't need to be isolated. We compare this targeted approach with a standard school class isolation strategy in which all classmates are isolated for 14 days whenever someone develops symptoms.
Scenario Summary
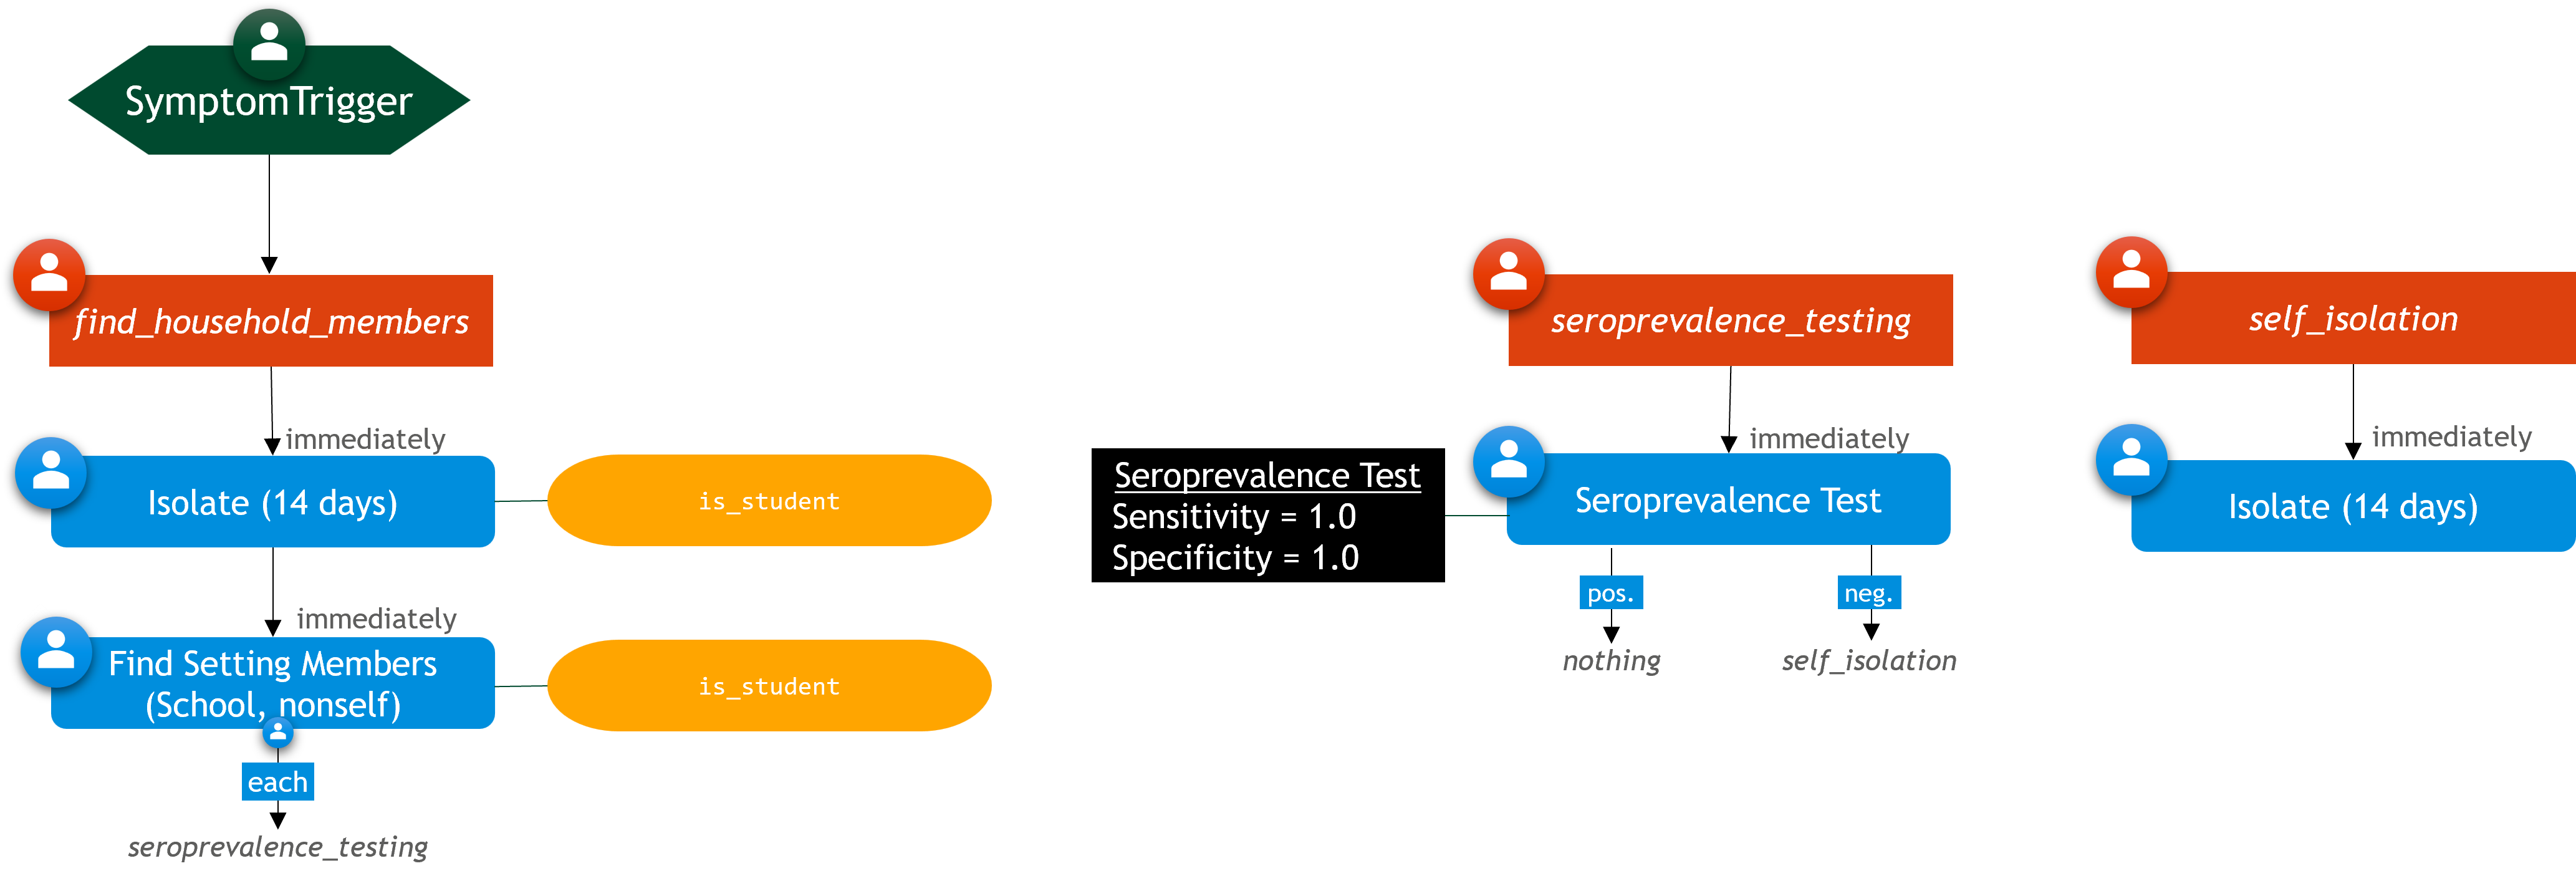
- When a student shows symptoms: they isolate for 14 days and all their classmates are tested for antibodies.
- Only students who test negative are isolated.
- Students who test positive (i.e., immune) are not isolated.
- The tests are assumed to be perfect (100% sensitivity and specificity).
using GEMS

# SCENARIO 1: simulation with 14-day isolation for all individuals in the schoolclass
isolation = Simulation(label="isolation")
self_isolation = IStrategy("Self Isolation", isolation)
add_measure!(self_isolation, SelfIsolation(14))

# identify list of students in class
find_class_members = IStrategy("Find Schoolclass Members", isolation)
add_measure!(find_class_members, FindSettingMembers(SchoolClass, self_isolation)
, condition=is_student)

# trigger "schoolclass tracing"
trigger = SymptomTrigger(find_class_members)
add_symptom_trigger!(isolation, trigger)

# SCENARIO 2: here all students get a test and only go into isolation if it is negative
seroprevalence_testing = Simulation(label="seroprevalence_testing")

# define the test type
seroprevalence_test = SeroprevalenceTestType("Seroprevalence Test",
pathogen(seroprevalence_testing), seroprevalence_testing)

# isolation strategy
self_isolation = IStrategy("Self Isolation", seroprevalence_testing)
add_measure!(self_isolation, SelfIsolation(14))

# define testing strategy that triggers self isolation
testing = IStrategy("Testing", seroprevalence_testing)
add_measure!(testing, Test("Test", seroprevalence_test,
negative_followup=self_isolation), condition = is_student)

find_class_members = IStrategy("Find Class Members", seroprevalence_testing)
add_measure!(find_class_members, FindSettingMembers(Household, testing, nonself=true)
, condition = is_student)

# students with symptoms go in isolation anyway
add_measure!(find_class_members, SelfIsolation(14), condition=is_student)

# trigger "schoolclass tracing"
trigger = SymptomTrigger(find_class_members)
add_symptom_trigger!(seroprevalence_testing, trigger)

# run both scenarios
run!(isolation)
run!(seroprevalence_testing)

# get the results
rd_i = ResultData(isolation)
rd_s = ResultData(seroprevalence_testing)

# Visualize the results
gemsplot([rd_s, rd_i], type = (:TickCases, :CumulativeIsolations, :TickSeroTests))
Plot
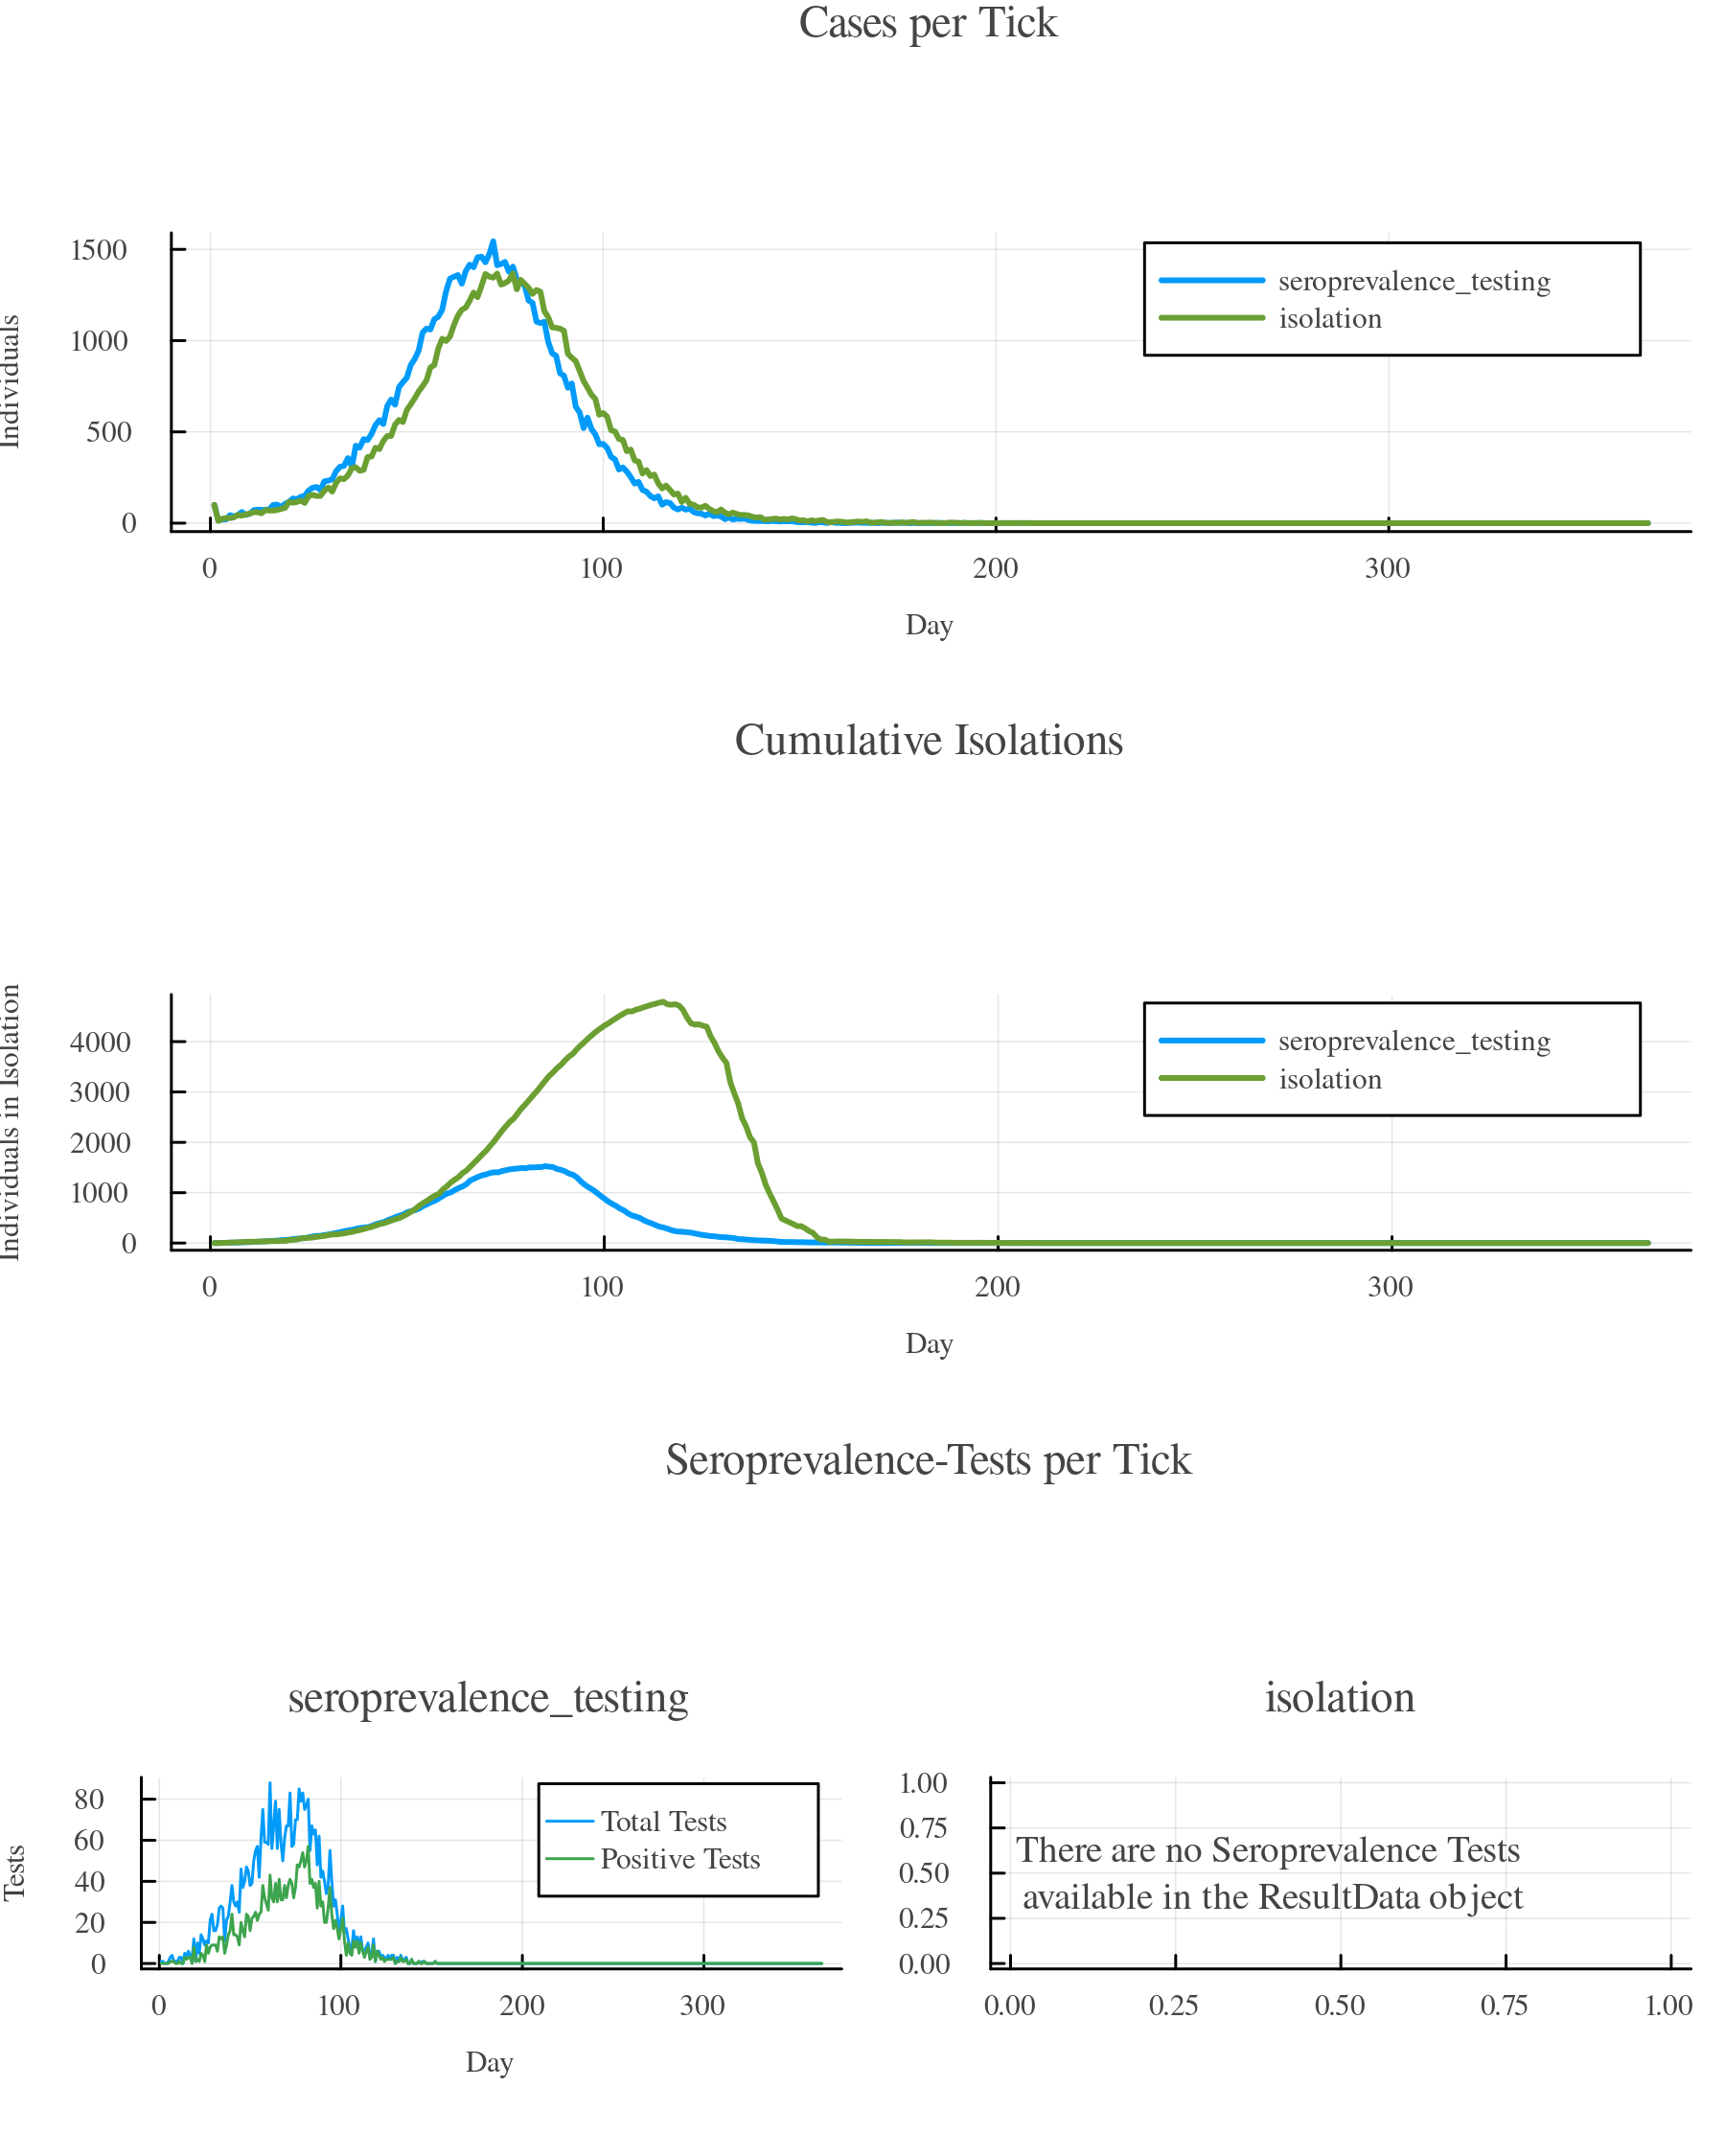
Both scenarios result in similar numbers of cases, meaning the spread of infection is effectively controlled in both. However, the seroprevalence testing scenario leads to significantly fewer isolations. This demonstrates that targeted testing can avoid unnecessary isolation for immune individuals without increasing transmission risk.
Multiple Test Types
In this scenario, we combine two test types —PCR and Antigen— to balance testing accuracy, cost, and availability. PCR tests are highly accurate but may be costly or limited in supply, while antigen tests are cheaper and easier to administer but less sensitive.
The testing strategy works as follows: Symptomatic individuals receive a PCR test directly. If positive, they are counted as confirmed cases. To also identify asymptomatic or pre-symptomatic cases, everyone in the symptomatic individual's household is tested using an antigen test. If a household member tests positive on the antigen test, they are given a follow-up PCR test for confirmation. Only PCR tests are reportable in this scenario, which avoids double-counting cases detected via both test types.
Scenario Summary:
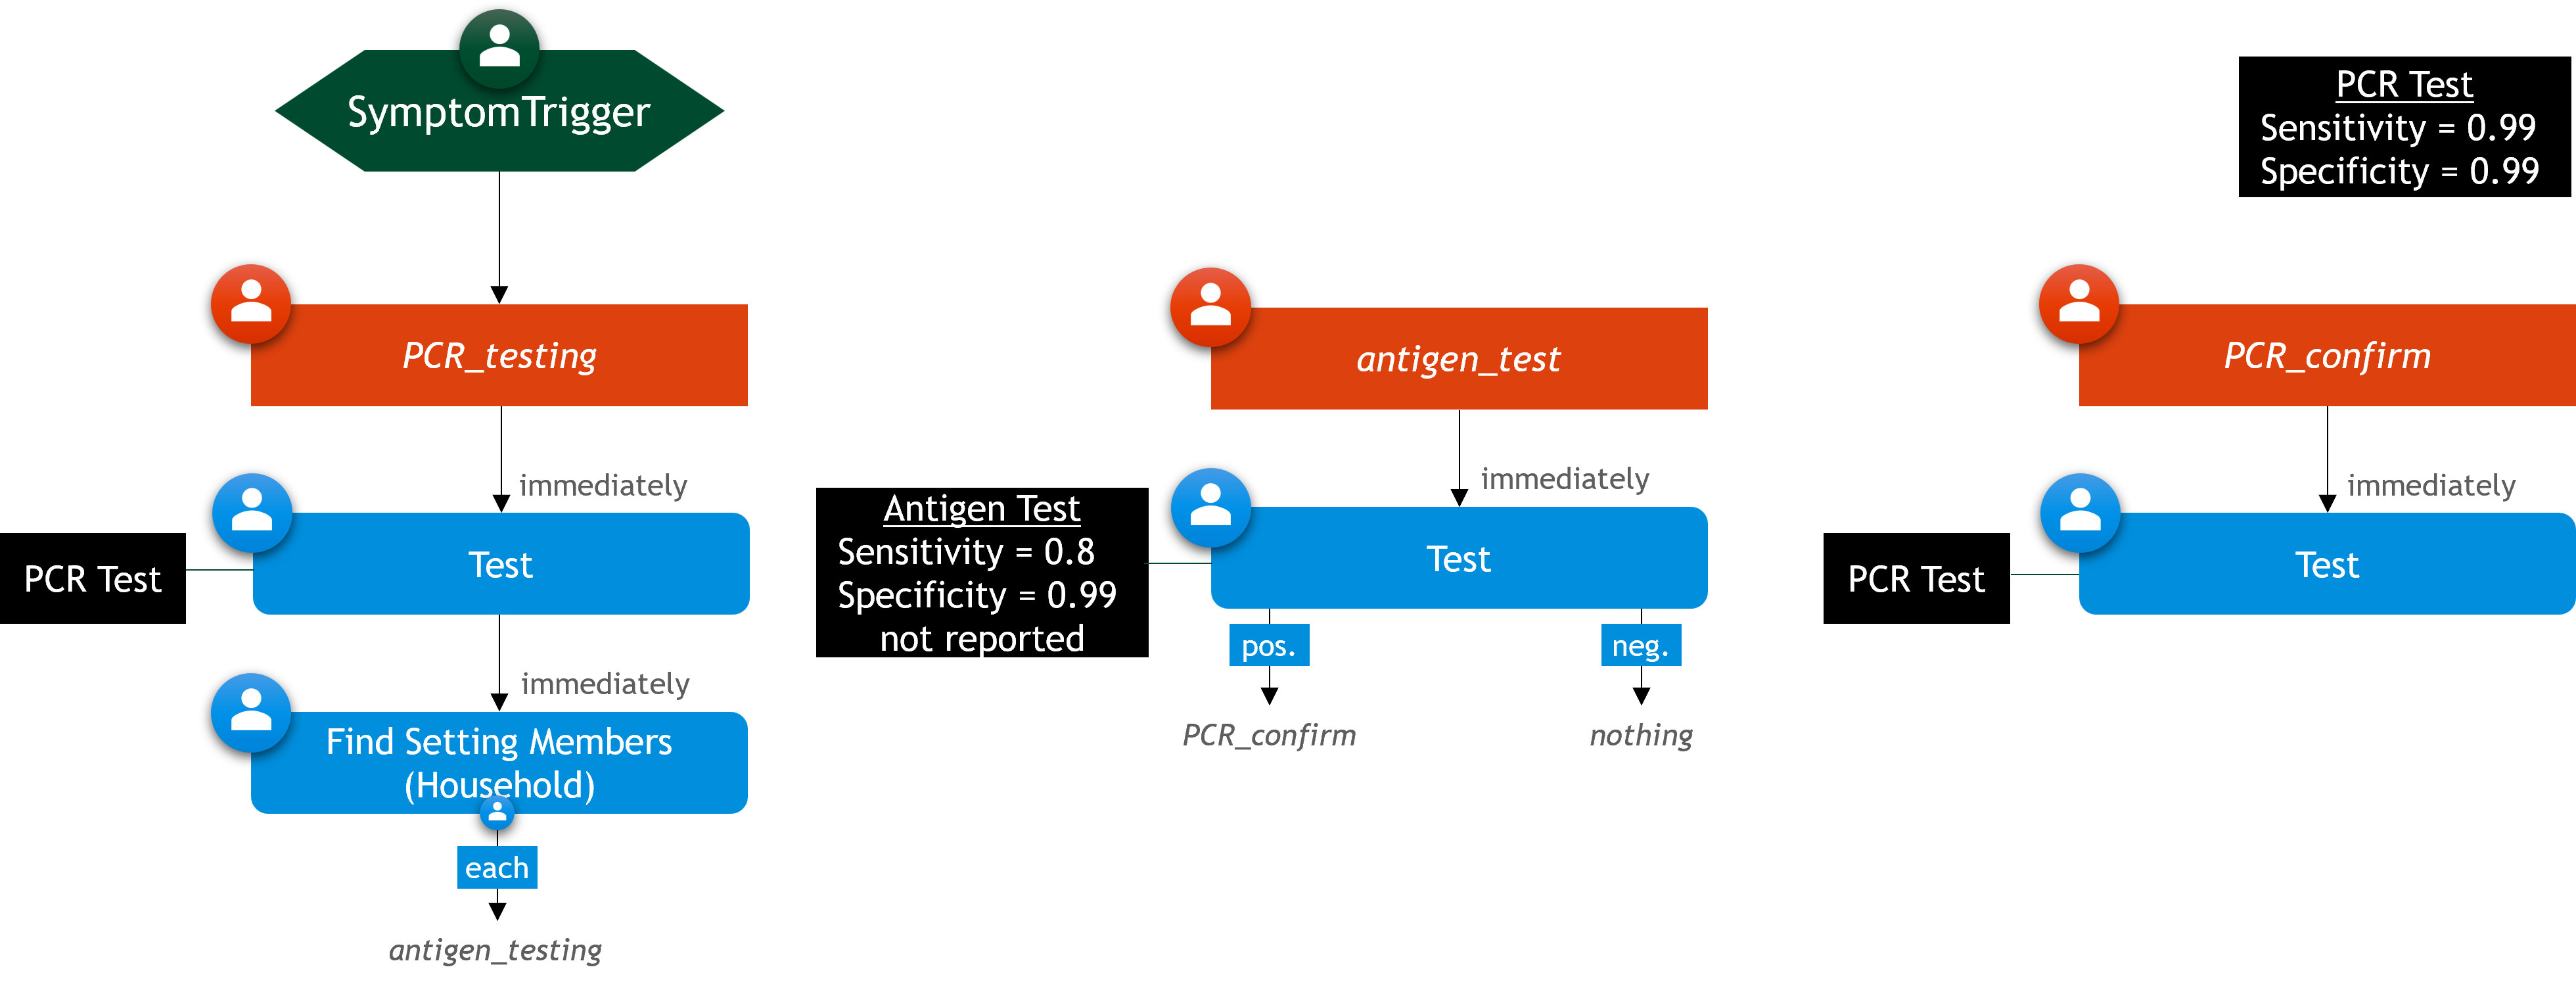
- Symptomatic individuals are tested with a PCR test.
- All other household members are tested with an Antigen test.
- A positive Antigen test triggers a follow-up PCR test.
- Only PCR tests are reported.
- This allows identifying both symptomatic and some asymptomatic cases, while controlling for test availability and cost.
using GEMS

scenario = Simulation(label = "Multiple Test Types")

# define test type (PCR test)
PCR_Test = TestType("PCR Test", pathogen(scenario), scenario,
 sensitivity = 0.99, specificity = 0.99)
# define second test type (Antigen test)
Antigen_Test = TestType("Antigen Test", pathogen(scenario), scenario,
 sensitivity = 0.8, specificity = 0.99)

# define PCR-confirm-testing strategy
PCR_confirm_testing = IStrategy("PCR confirm Test", scenario)
add_measure!(PCR_confirm_testing, Test("PCR Test", PCR_Test))

# define antigen testing strategy
antigen_testing = IStrategy("Antigen Testing", scenario)
add_measure!(antigen_testing, Test("Antigen Test", Antigen_Test,
 positive_followup = PCR_confirm_testing, reportable = false))

PCR_symptom_test = IStrategy("PCR Symptom Testing", scenario)
add_measure!(PCR_symptom_test, Test("PCR Symptom Test", PCR_Test))
add_measure!(PCR_symptom_test, FindSettingMembers(Household, antigen_testing,
 nonself = true))

trigger = SymptomTrigger(PCR_symptom_test)
add_symptom_trigger!(scenario, trigger)

run!(scenario)

rd_s = ResultData(scenario)

gemsplot(rd_s, type = (:TickTests, :TestPositiveRate, :DetectedCases),
 series = [:total_tests])
Plot
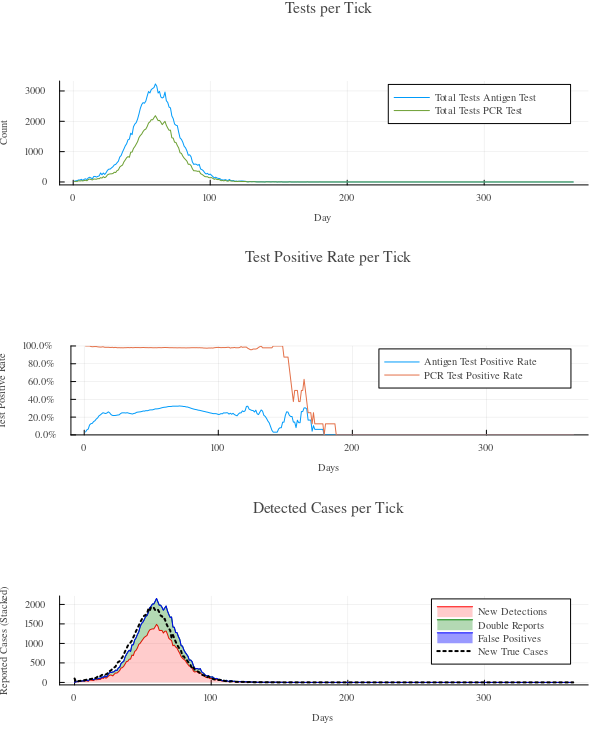
The results show both the number of tests performed and the test positivity rate over time. The plot helps evaluate the effectiveness of this combined testing strategy in detecting cases without overwhelming PCR capacity.
Contact Reduction
This scenario demonstrates a simple intervention: reducing contacts in specific settings (offices and schoolclasses) beginning 50 days into the epidemic. The reduction is modeled using a structural strategy that changes how contacts are generated within those settings. Instead of fully removing individuals or closing the settings, we apply a ChangeContactMethod intervention. This uses ContactparameterSampling(0.5), which modifies the internal contact-generation model to sample daily contacts using a Poisson distribution centered around the setting's contact parameter. This introduces stochastic variability while preserving the overall contact intensity, potentially modeling scenarios such as staggered attendance, smaller groups, or informal distancing behaviors.
Scenario Summary:
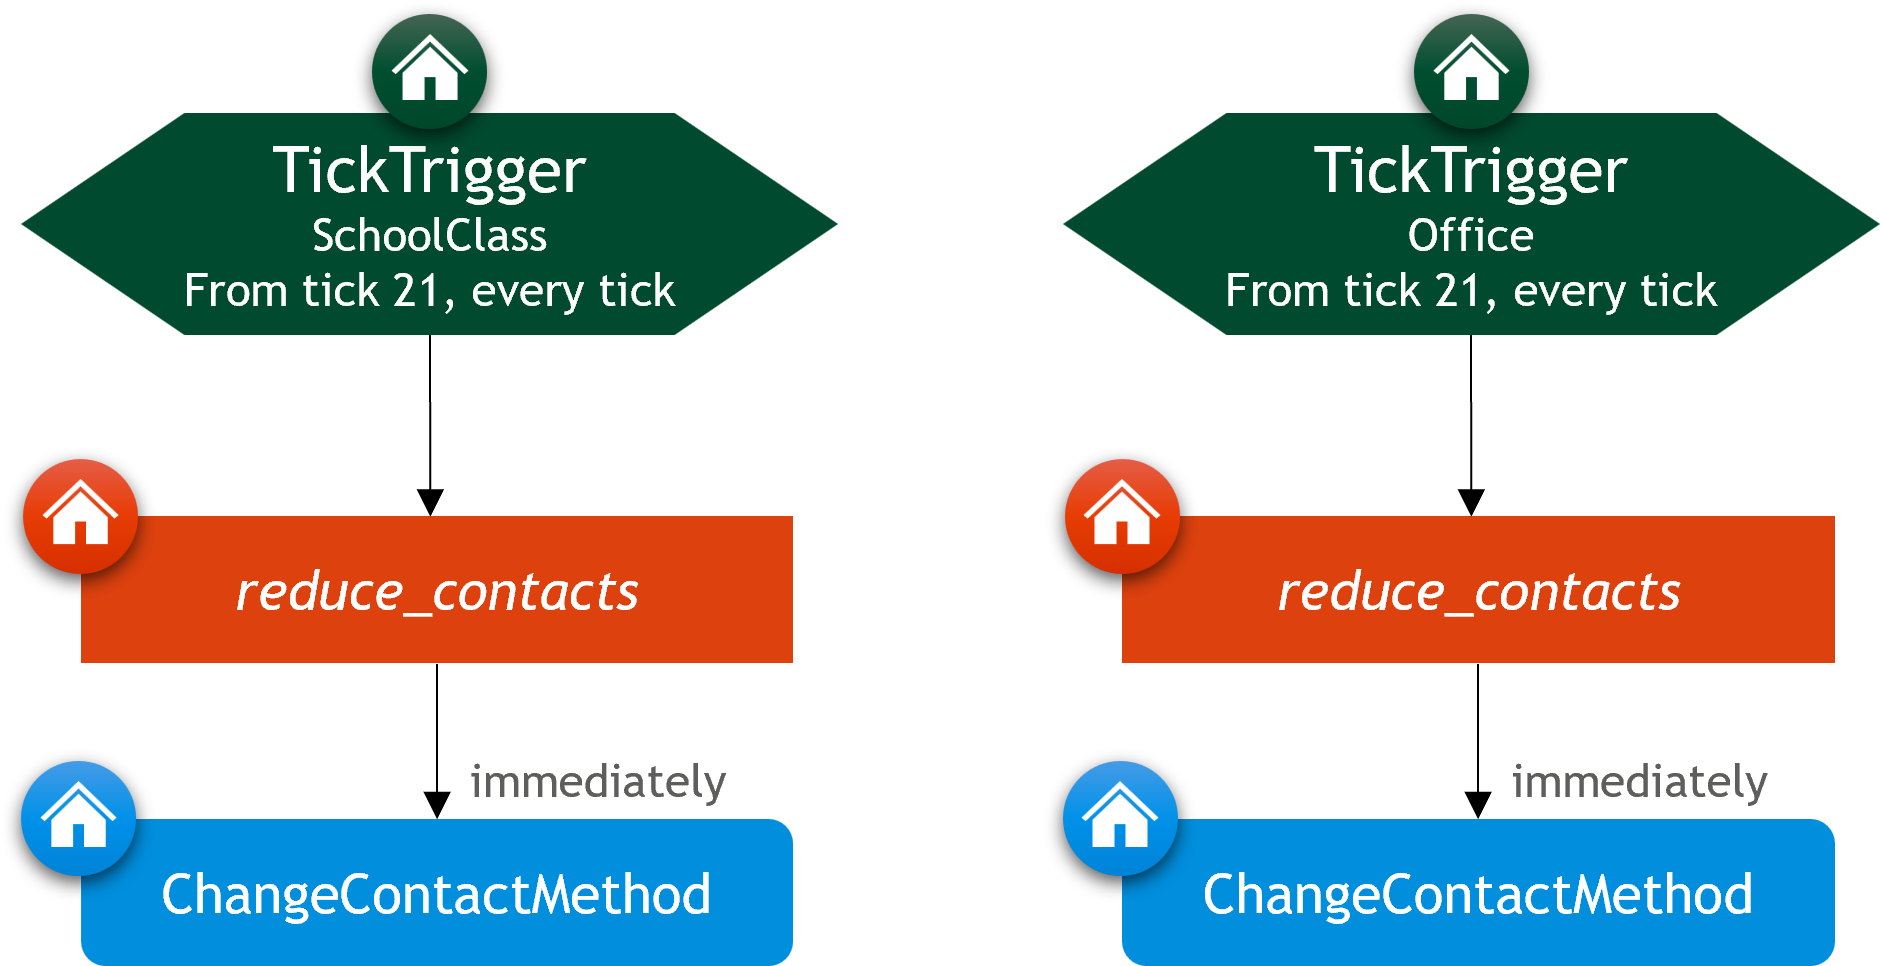
- Contacts are reduced in offices and schoolclasses starting on day 50 of the simulation.
- The intervention is implemented using a Poisson-based contact sampling method.
- This models a soft contact reduction rather than full setting closure.
- No changes are made to household contacts.
using GEMS

scenario = Simulation(label = "Contact Reduction")

reduce_contacts = SStrategy("Reduce Contacts", scenario)
add_measure!(reduce_contacts, ChangeContactMethod(ContactparameterSampling(0.5)))

trigger = STickTrigger(SchoolClass, reduce_contacts, switch_tick = Int16(50))
add_tick_trigger!(scenario, trigger)

trigger = STickTrigger(Office, reduce_contacts, switch_tick = Int16(50))
add_tick_trigger!(scenario, trigger)

run!(scenario)
rd_s = ResultData(scenario)

gemsplot(rd_s, type = (:TickCases, :TickCasesBySetting))
Plot
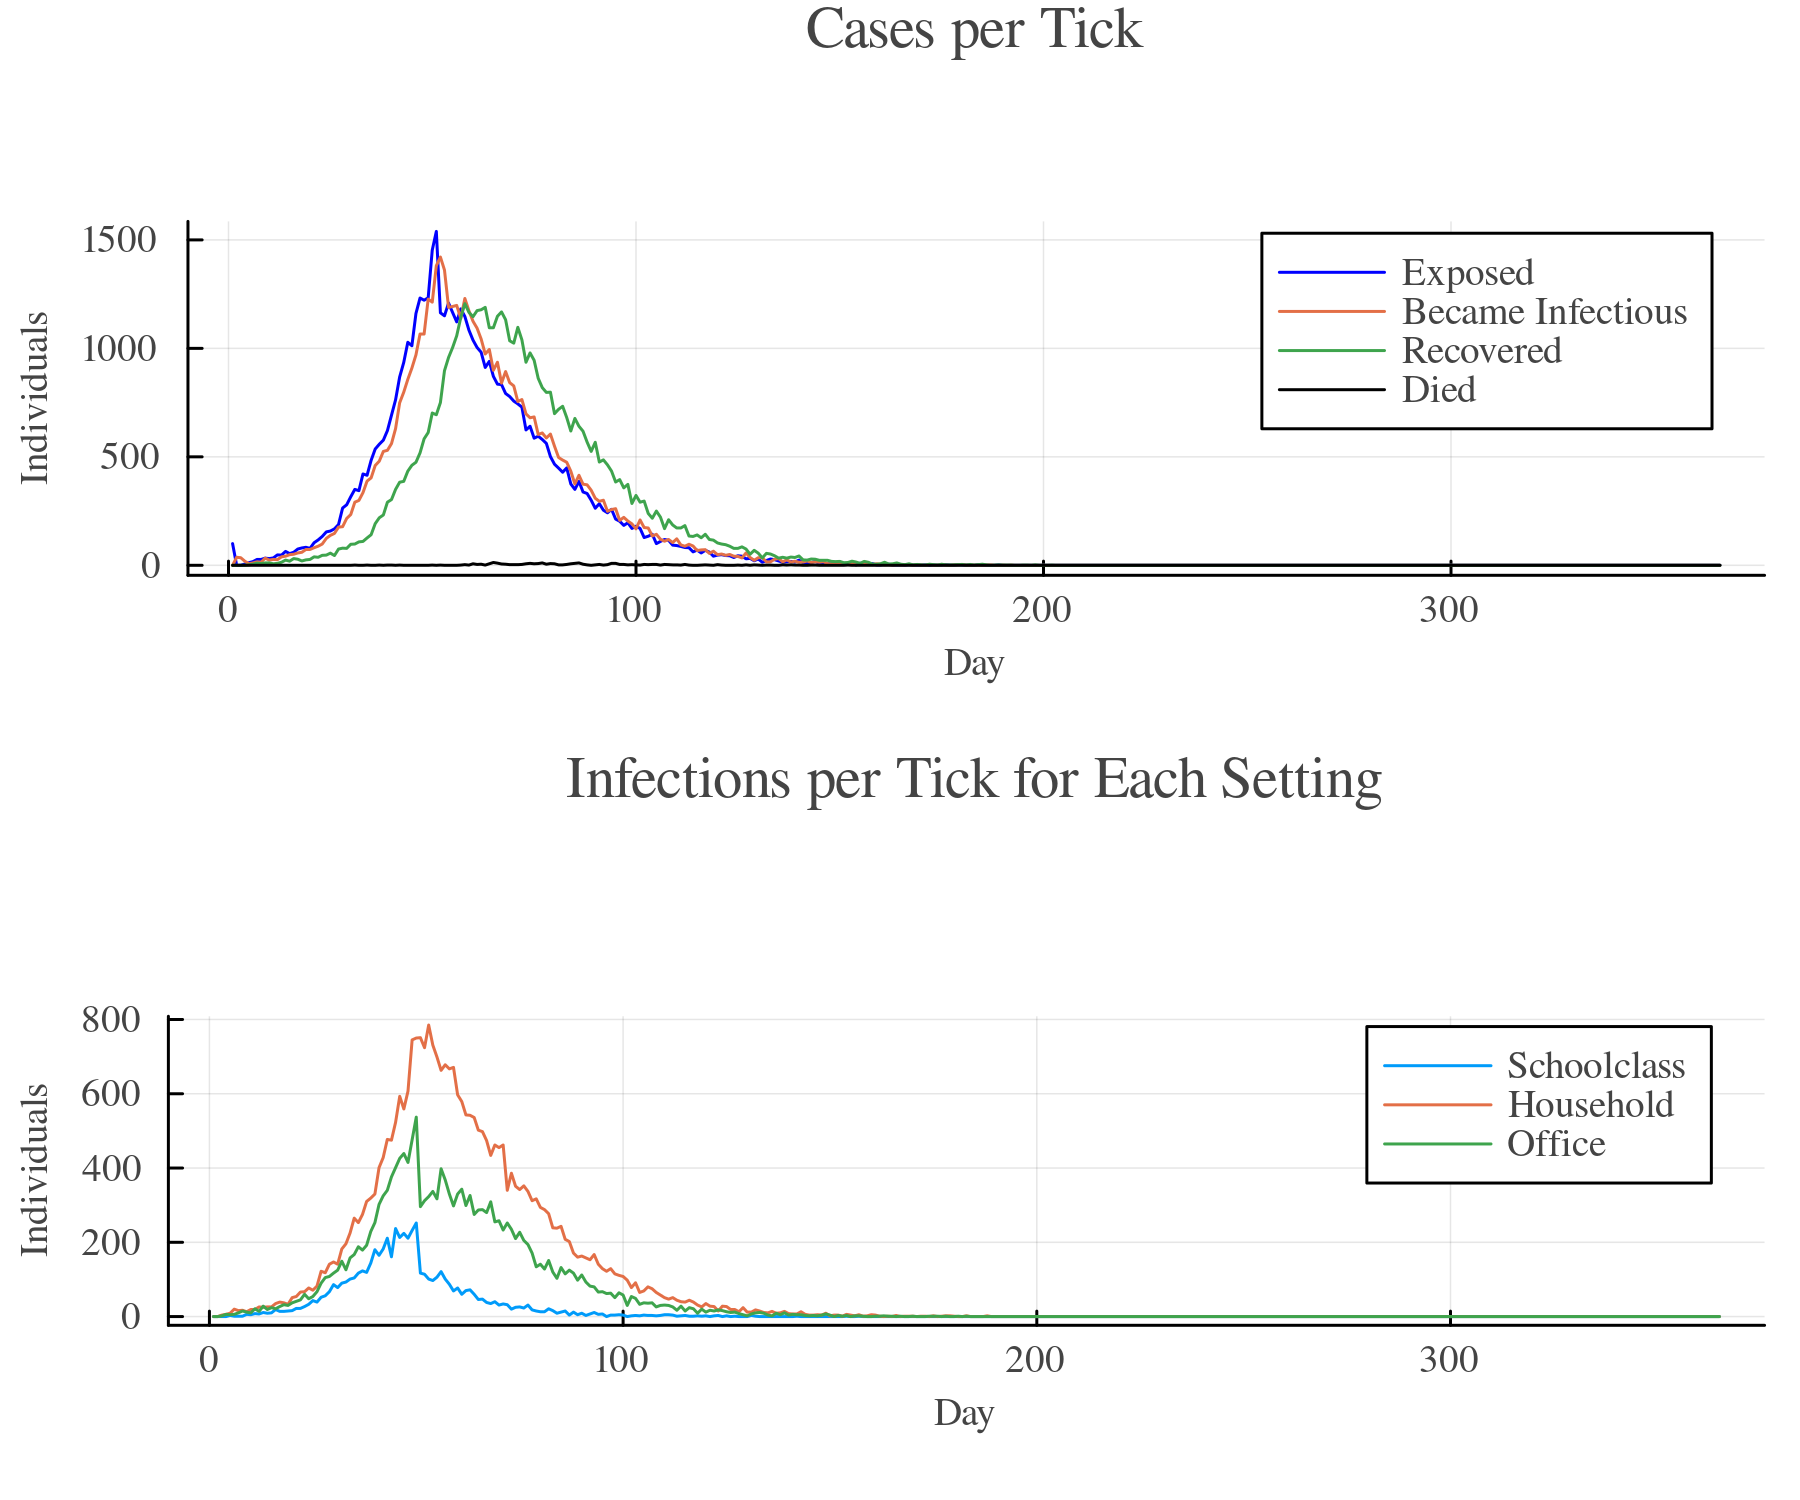
The results show how case numbers evolve over time and how cases are distributed across settings. You can observe whether the reduction in structured settings (office, schoolclass) slows the epidemic or shifts transmission into other areas like households.
Setting Closure
This section presents two examples of closing settings during an outbreak: one that targets all schools after a fixed time, and another that reacts dynamically by closing and reopening specific school classes based on symptoms.
Example 1: Timed School Closure
In this scenario, all schools are closed on day 42, six weeks into the epidemic. This is a structural intervention applied using the CloseSetting() measure, which disables contact interactions within the affected setting. Since default populations in GEMS only include low-level settings (like SchoolClass), we use the "SL" population model (based on Saarland), which includes container settings such as full schools. To allow the epidemic to develop more gradually and better highlight the effect of the intervention, we reduce the transmission rate.
Scenario Summary:
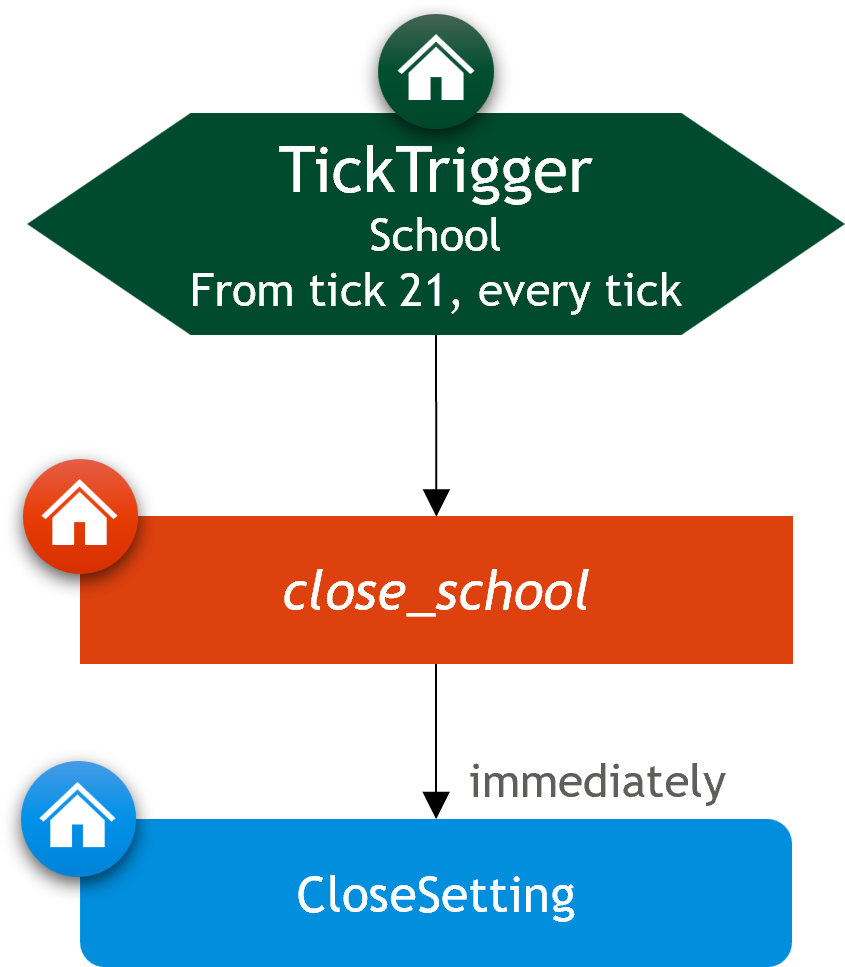
- Simulation uses the Saarland ("SL") population with container settings like full schools.
- All schools are closed on tick 42 (day 42 of the outbreak).
- The intervention halts all school-related transmission from that point onward.
using GEMS
using Plots

scenario = Simulation(label = "School-Closing", population="SL", transmission_rate=0.05)

school_closing = SStrategy("Close Schools", scenario)
add_measure!(school_closing, CloseSetting())

trigger = STickTrigger(School, school_closing, switch_tick = Int16(42))
add_tick_trigger!(scenario, trigger)

run!(scenario)
rd_s = ResultData(scenario)

gemsplot(rd_s, type = (:TickCases, :TickCasesBySetting))
vline!([42], color = :red, linestyle = :dash, label = "School Closing")
Plot
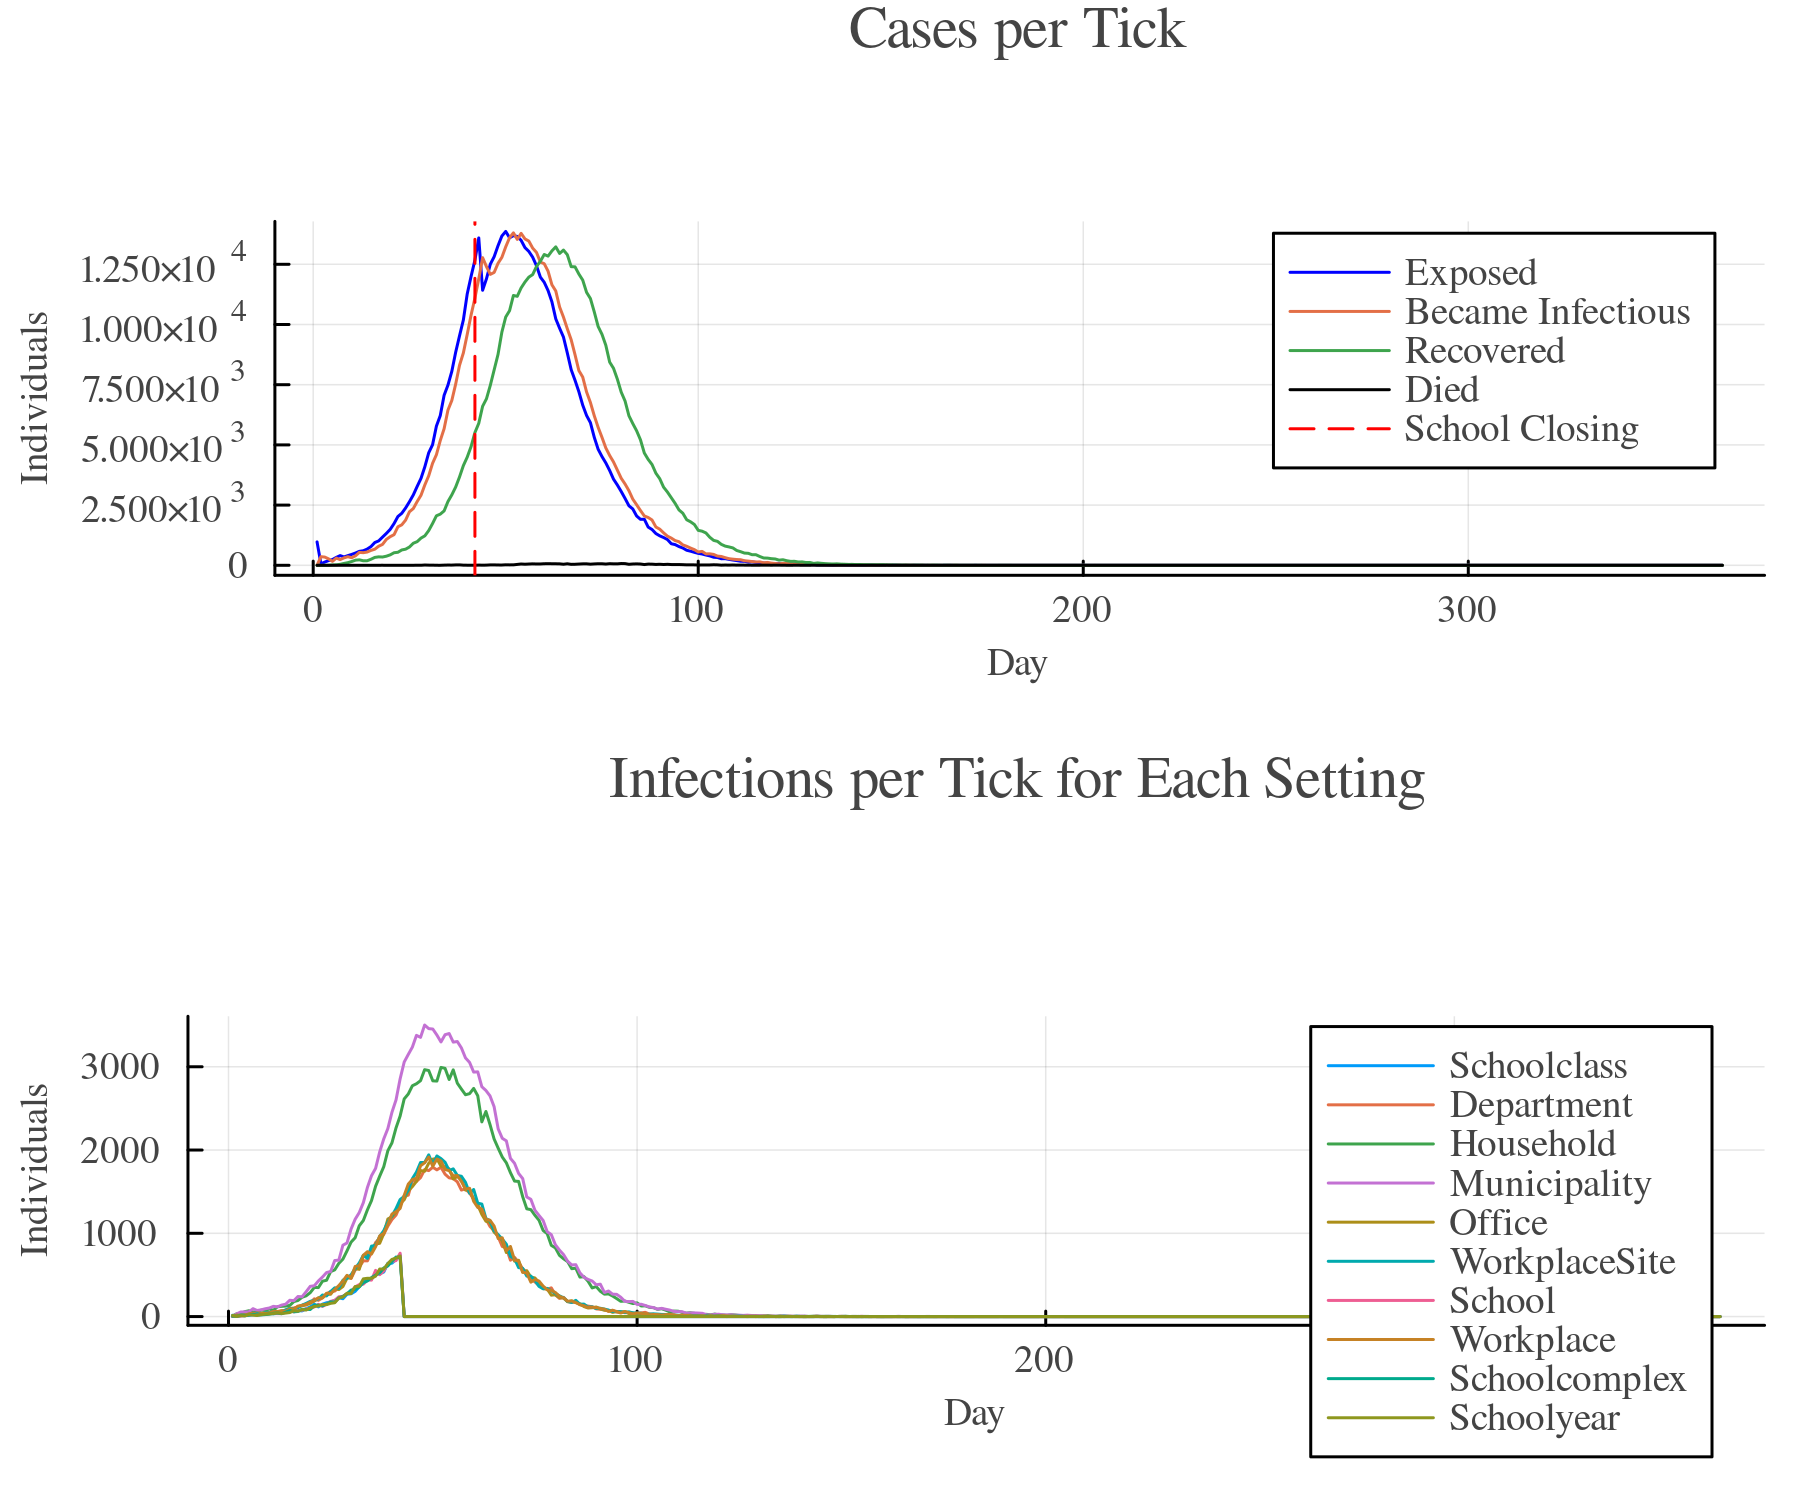
The results show that closing all schools on day 42 substantially reduces transmission within the school setting but has a limited effect on the overall epidemic peak.
Example 2: Reactive School Class Closure and Reopening
This scenario models a more granular, dynamic intervention: when a student develops symptoms, their school class is closed immediately. After 6 days, the class is automatically reopened. This simulates targeted closure of small units within schools, reflecting policies where only affected groups are temporarily isolated rather than entire institutions. This is implemented by:
- Detecting symptomatic students,
- Finding their associated SchoolClass,
- Applying both
CloseSetting()and, after a delay,OpenSetting().
We compare this scenario with a simulation without any interventions.
Scenario Summary:
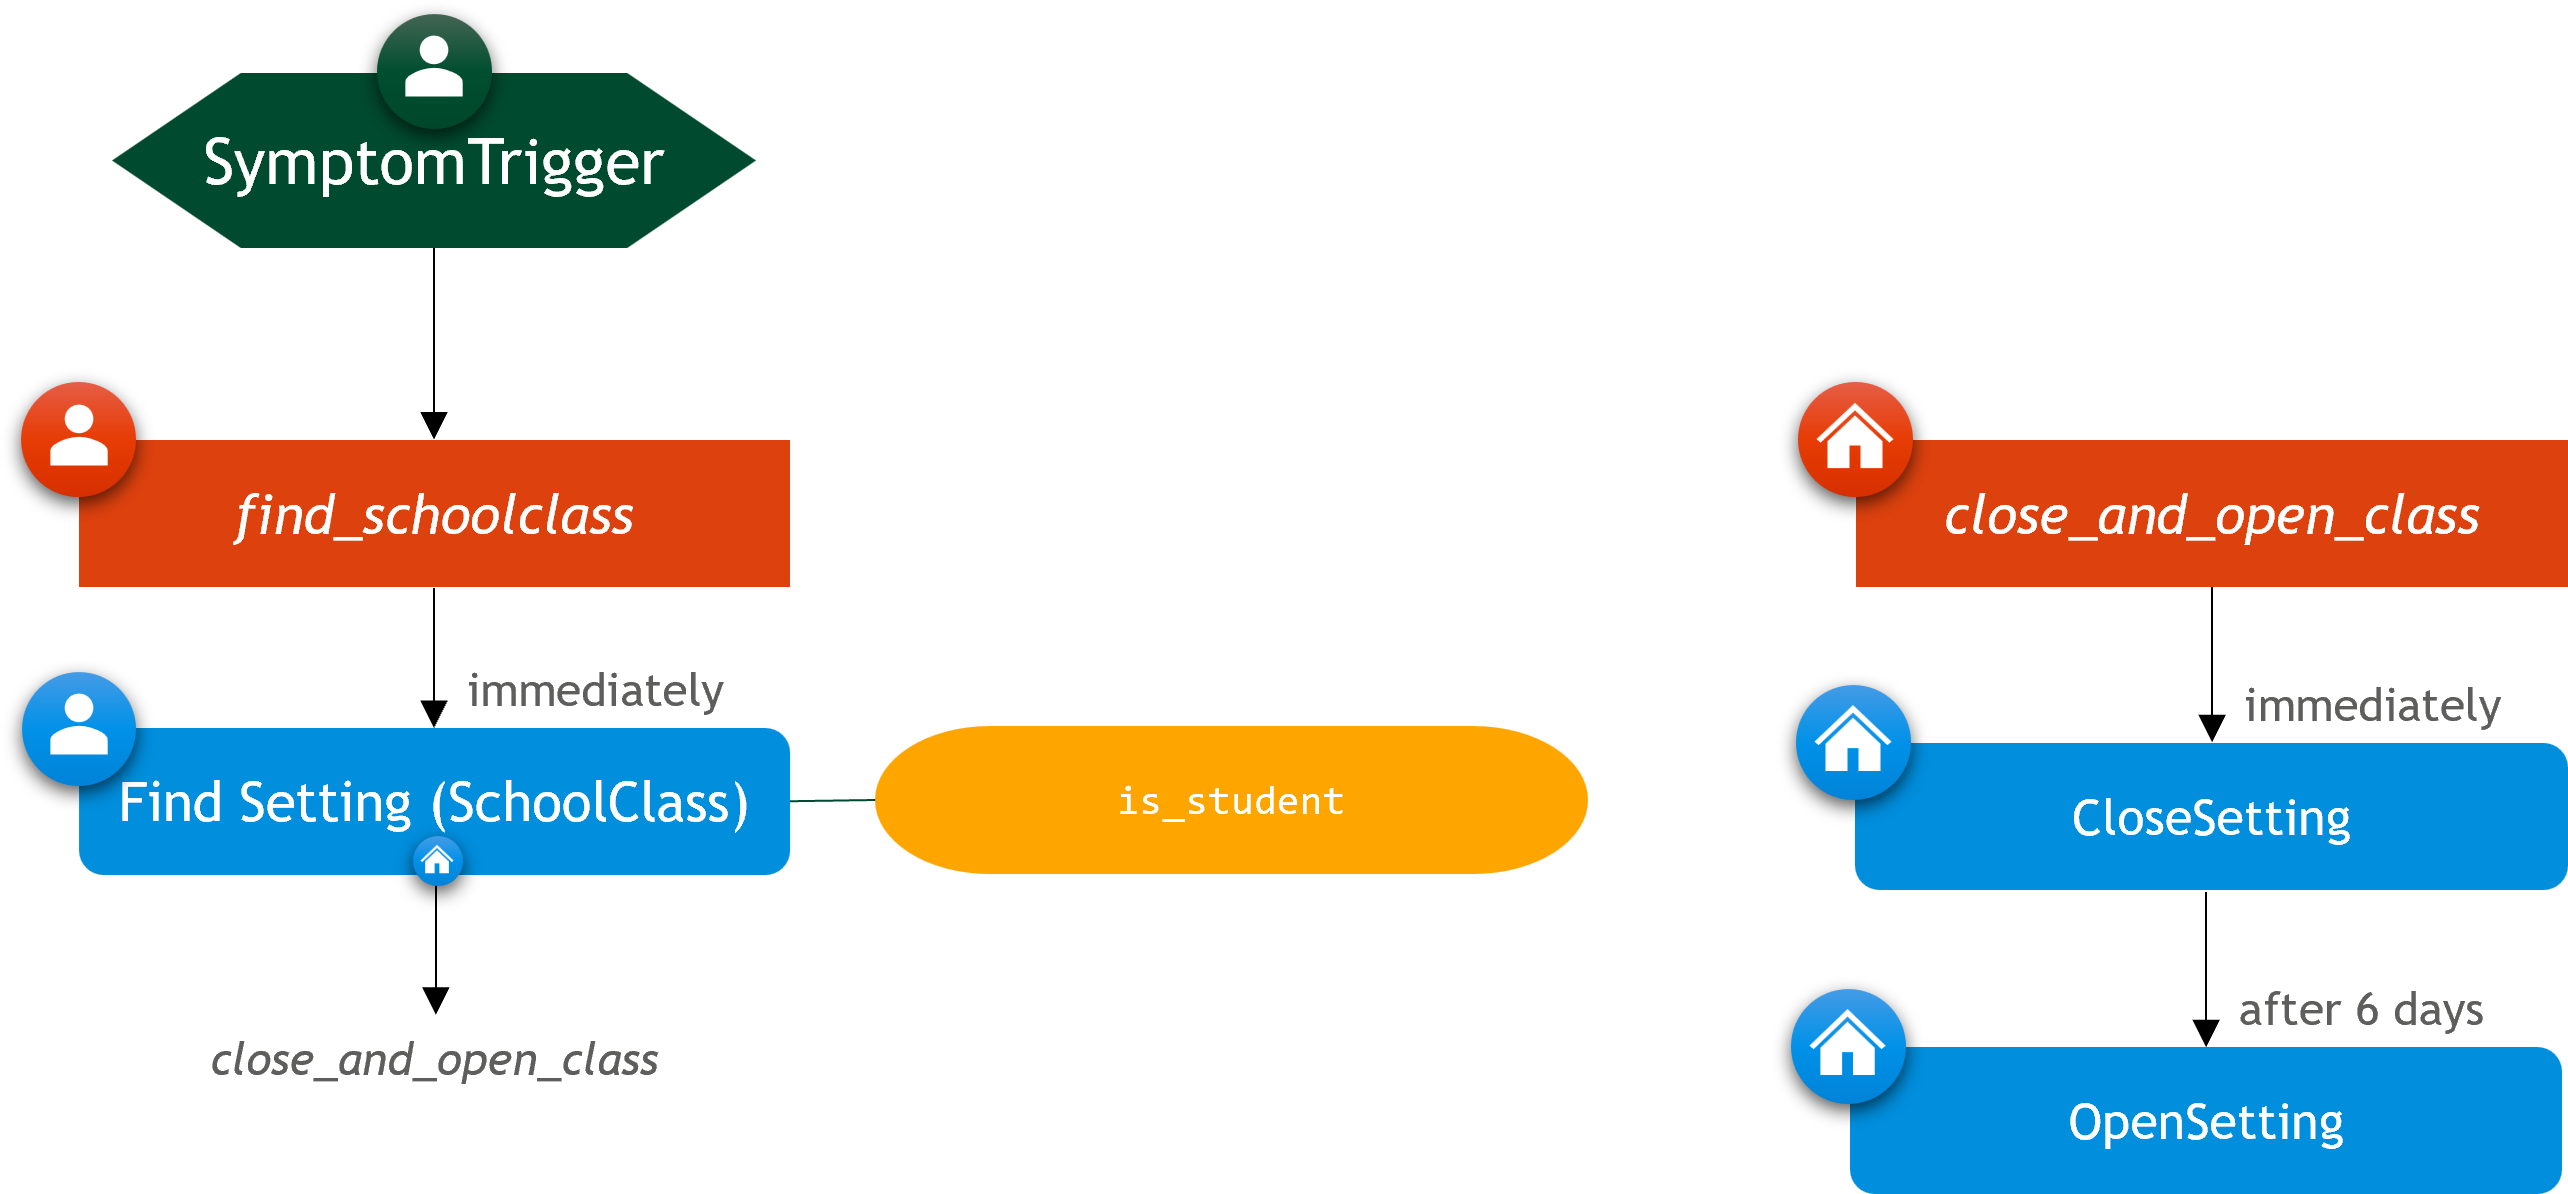
- If a student becomes symptomatic, their school class is closed immediately.
- The class is reopened automatically after 6 days.
- This approach allows localized, temporary closures, minimizing disruption.
- Other settings (e.g., households or offices) are unaffected.
using GEMS

baseline = Simulation(label = "Baseline")
scenario = Simulation(label = "Close School-Classes")

close_and_open_class = SStrategy("Close and Open Class", scenario)
add_measure!(close_and_open_class, CloseSetting())
add_measure!(close_and_open_class, OpenSetting(), offset = 6)

find_schoolclass = IStrategy("Find Class", scenario)
add_measure!(find_schoolclass, FindSetting(SchoolClass, close_and_open_class),
 condition = is_student)

trigger = SymptomTrigger(find_schoolclass)
add_symptom_trigger!(scenario, trigger)

run!(baseline)
run!(scenario)

rd_b = ResultData(baseline)
rd_s = ResultData(scenario)

gemsplot([rd_s, rd_b], type = (:TickCases, :TickCasesBySetting))
Plot
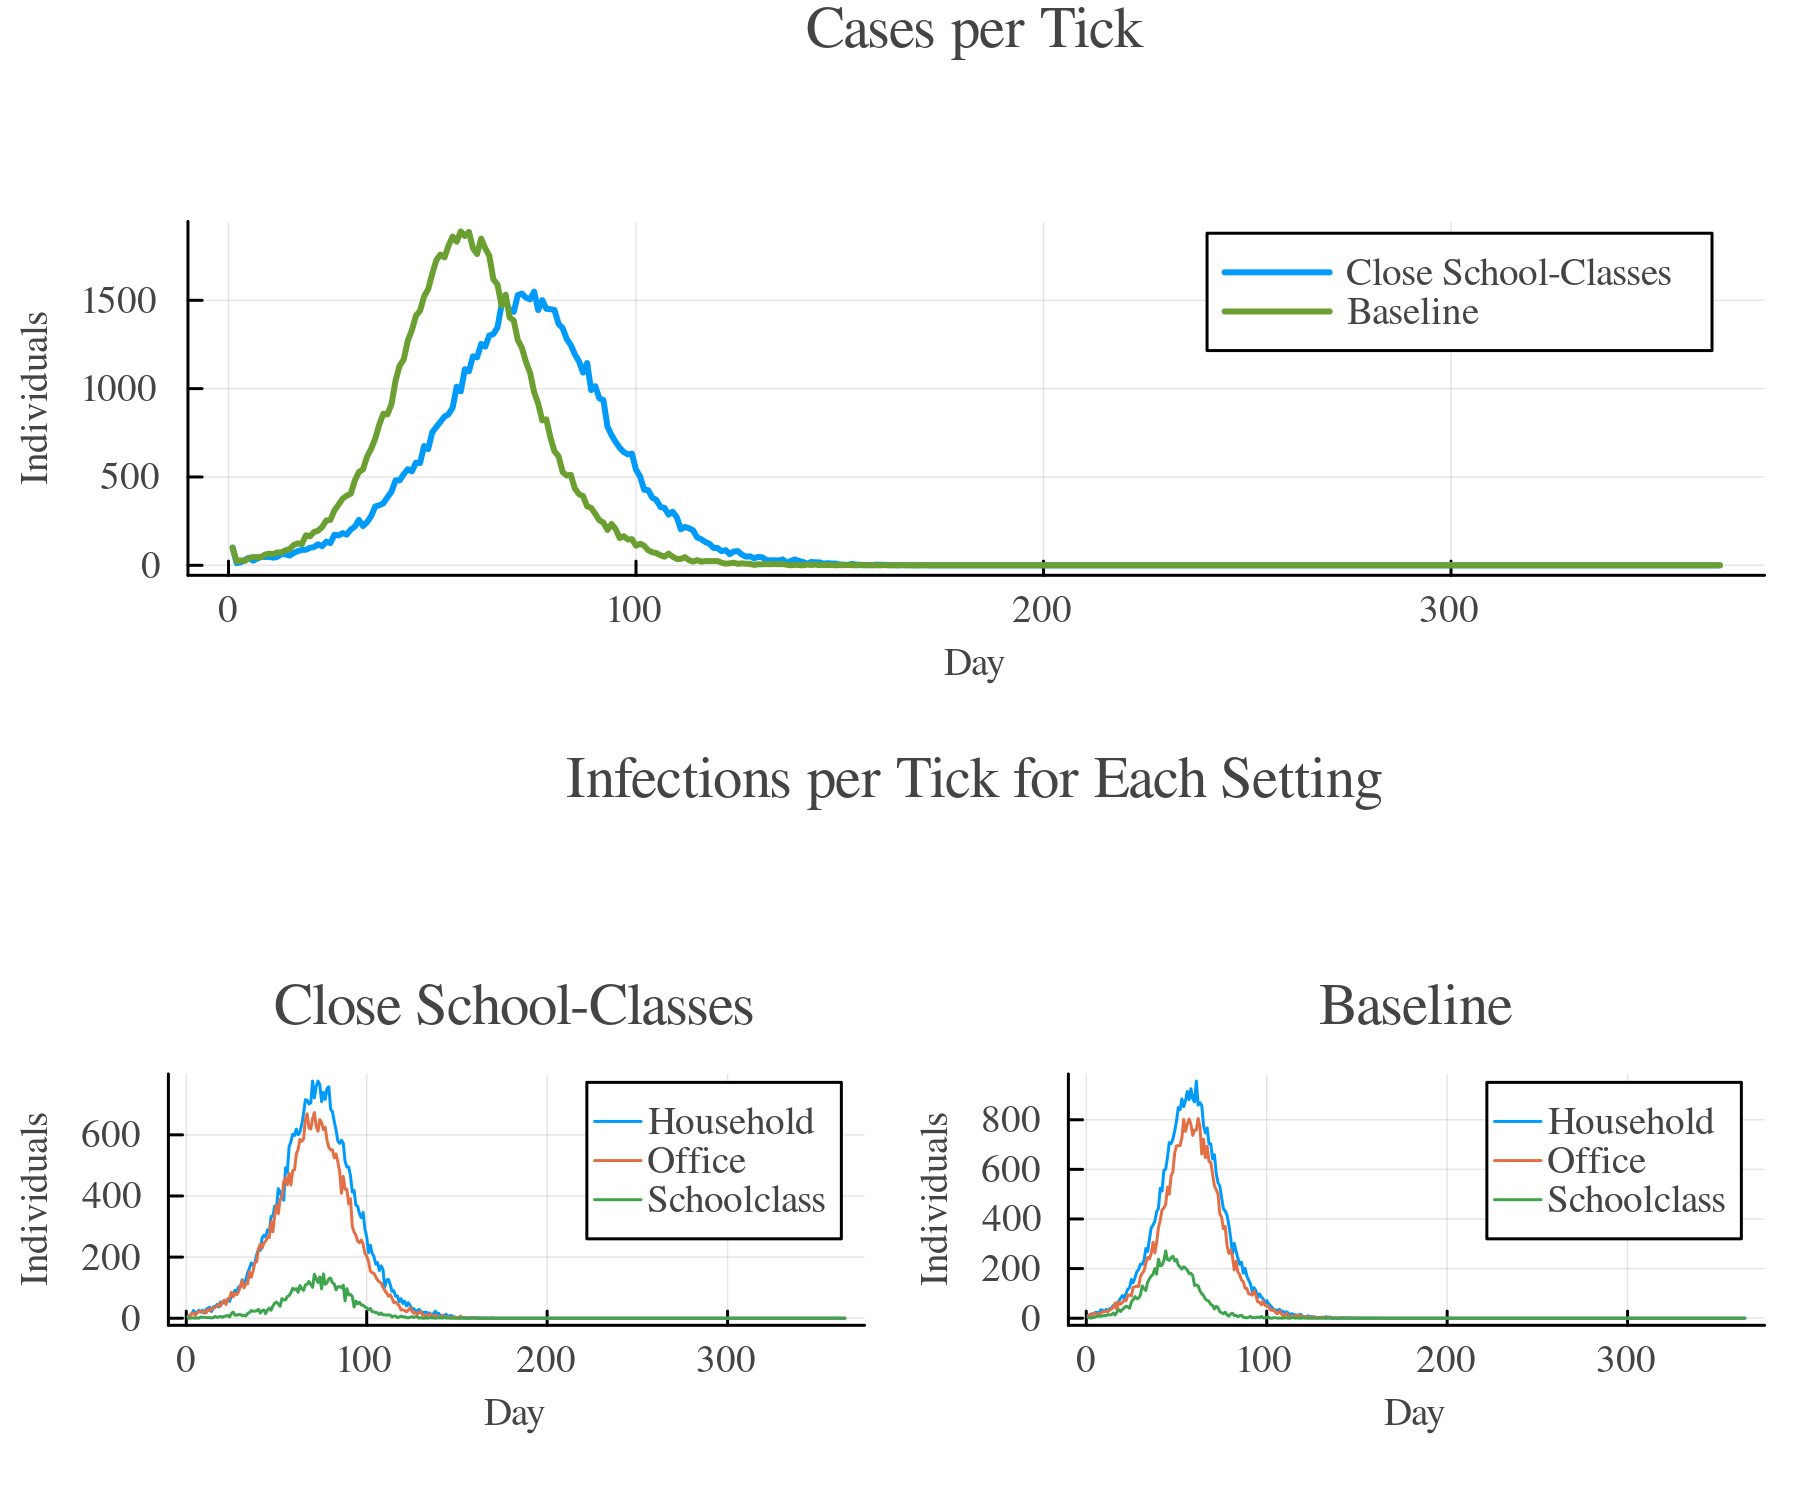
The results show fewer cases overall, but especially fewer infections in schoolclasses.
Custom Measures
In this scenario, we explore how risk perception and behavioral change can be modeled dynamically using a custom measure. At the start of the simulation, no one is willing to follow isolation mandates—every individual has a mandate_compliance of 0, meaning they will never voluntarily isolate, even if symptomatic. However, people begin to adjust their behavior when someone they know is hospitalized. Specifically, if a person shares a setting (household, office, or schoolclass) with someone who is hospitalized, they become more cautious and begin to comply fully with isolation instructions (i.e., their mandate_compliance is set to 1.0). From that point on, if they develop symptoms, they will isolate for 14 days. We also made some modifications to the simulation parameters:
- The simulation starts with only 10 infected individuals, representing a very early outbreak stage.
- The disease progression is configured such that 10% of infected individuals require hospitalization, making the consequences of spread more severe and increasing the likelihood of behavior change.
We compare the scenario with a simulation without any interventions but the same parameters.
Scenario Summary:
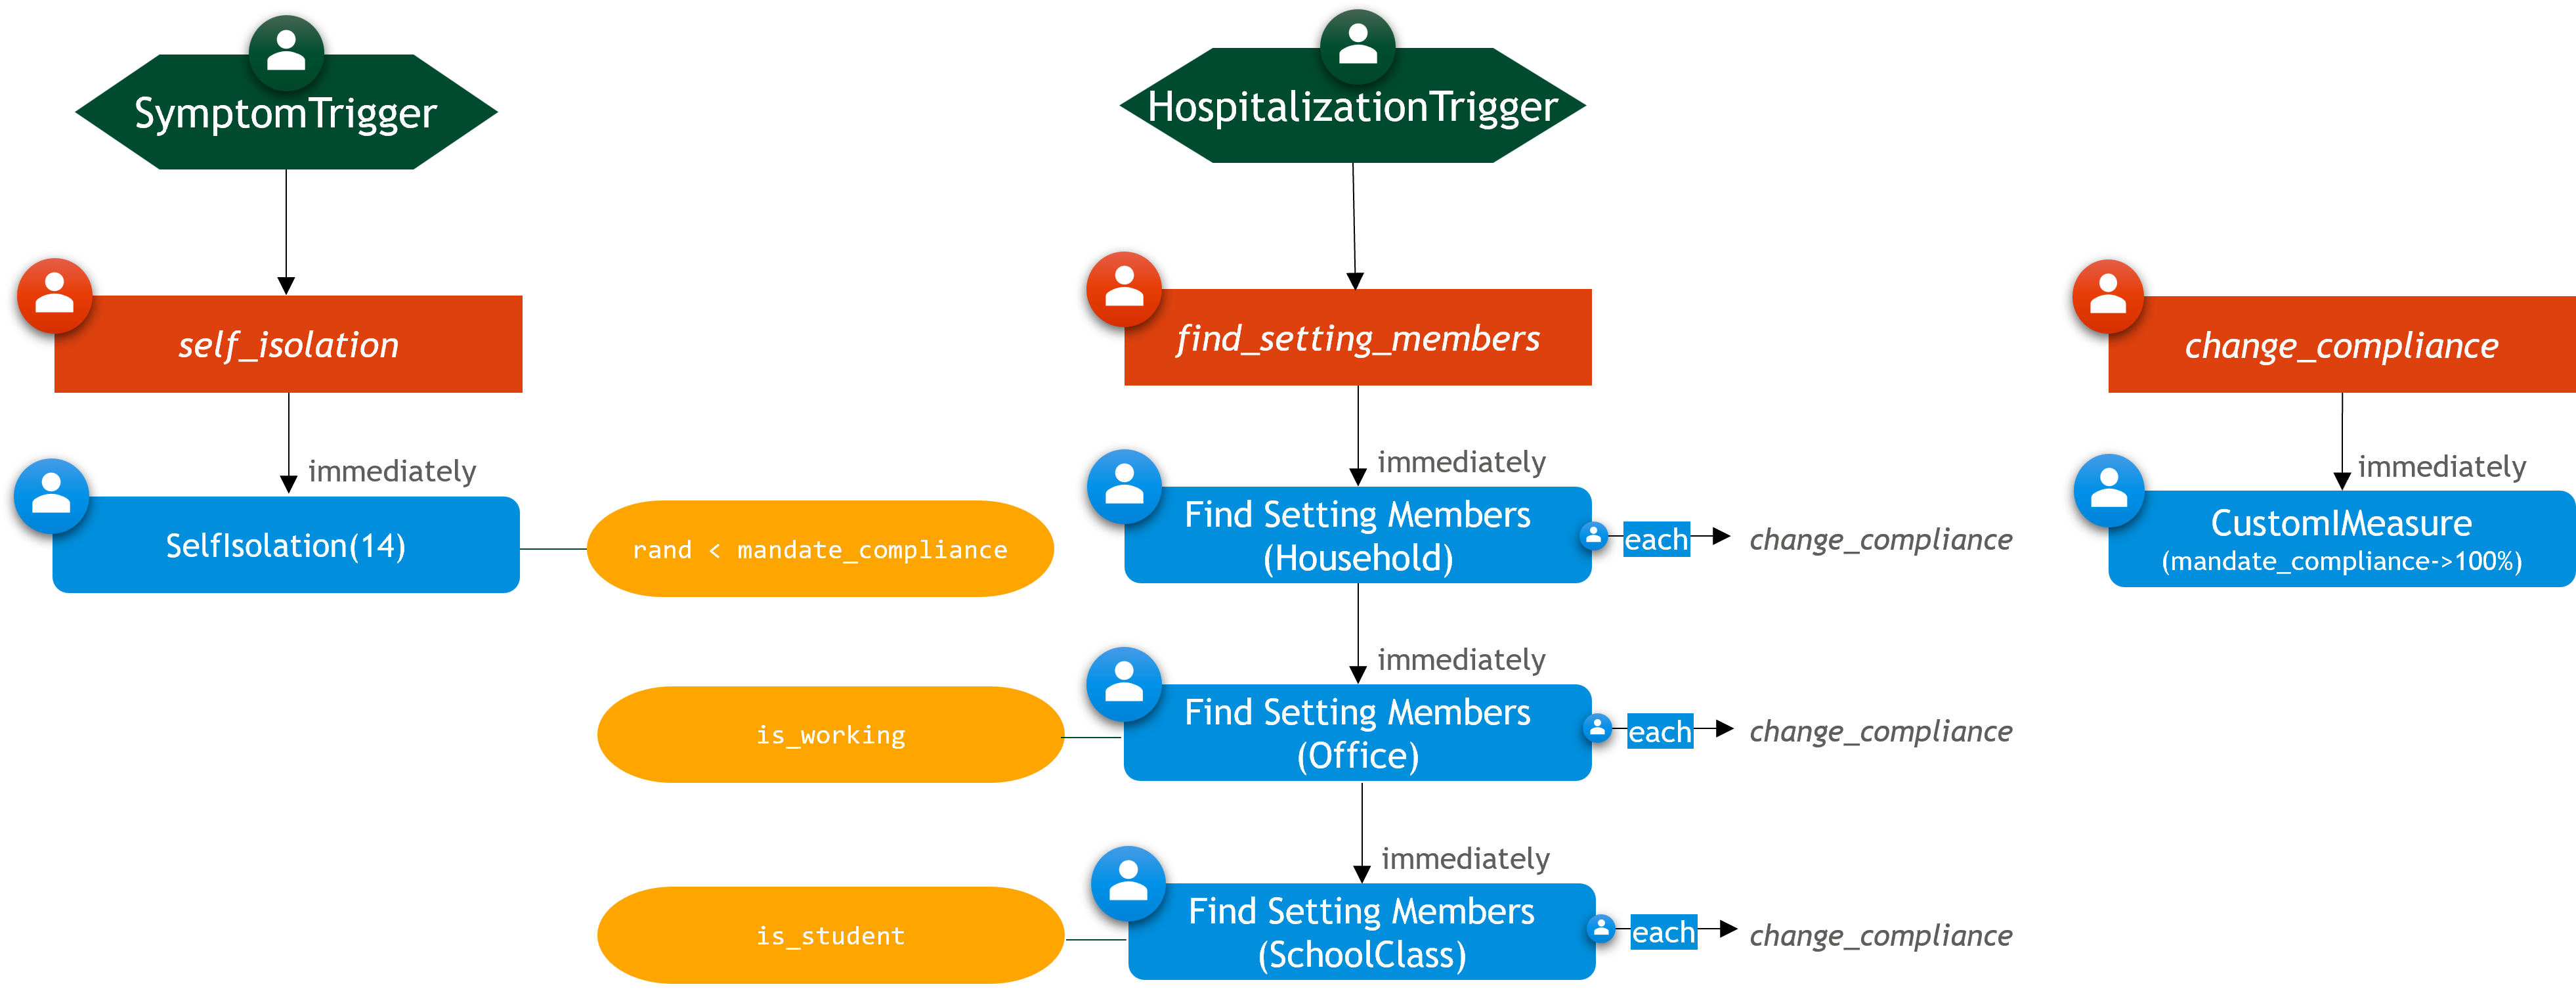
- At the beginning, no one follows isolation rules, even when sick.
- When someone is hospitalized, all contacts (in household, schoolclass, or office) become compliant with mandates.
- Compliant individuals isolate for 14 days if they develop symptoms.
- A custom measure is used to dynamically update individual behavior.
- A custom logger tracks the average level of compliance in the population.
- The simulation starts with very few infections and higher severity, emphasizing the impact of hospitalization events.
using GEMS

baseline = Simulation(label = "Baseline", infected_fraction = 0.0001)

# Set mandate compliance to 0 for all individuals
mandate_compliance!.(individuals(baseline), 0.0f0)

scenario = Simulation(label = "Change Mandate Compliance", infected_fraction = 0.0001)

mandate_compliance!.(individuals(scenario), 0.0f0)

self_isolation = IStrategy("Self Isolation", scenario)
add_measure!(self_isolation, SelfIsolation(14),
 condition = ind -> rand() < mandate_compliance(ind))

change_mandate_compliance = IStrategy("Change Risk Behavior", scenario)
add_measure!(change_mandate_compliance,
 CustomIMeasure((i, sim) -> mandate_compliance!(i, 1.0f0)))

find_setting_members = IStrategy("Find Contacts", scenario)
add_measure!(find_setting_members,
 FindSettingMembers(Household, change_mandate_compliance, nonself = false))
add_measure!(find_setting_members,
 FindSettingMembers(SchoolClass, change_mandate_compliance, nonself = false),
  condition = is_student)
add_measure!(find_setting_members,
 FindSettingMembers(Office, change_mandate_compliance, nonself = false),
  condition = is_working)

symptom_trigger = SymptomTrigger(self_isolation)
add_symptom_trigger!(scenario, symptom_trigger)

hospital_trigger = HospitalizationTrigger(find_setting_members)
add_hospitalization_trigger!(scenario, hospital_trigger)

# custom logger
function avg_compliance(sim)
    inds = individuals(sim)
    return sum(mandate_compliance.(inds)) / length(inds)
end

cl = CustomLogger(avg_mandate_compliance = avg_compliance)
cl2 = CustomLogger(avg_mandate_compliance = avg_compliance)
customlogger!(scenario, cl)
customlogger!(baseline, cl2)

run!(scenario)
run!(baseline)

rd_s = ResultData(scenario)
rd_b = ResultData(baseline)

gemsplot([rd_s, rd_b], type = (:TickCases, :HospitalOccupancy, :CustomLoggerPlot),
 legend = :topright)
Plot
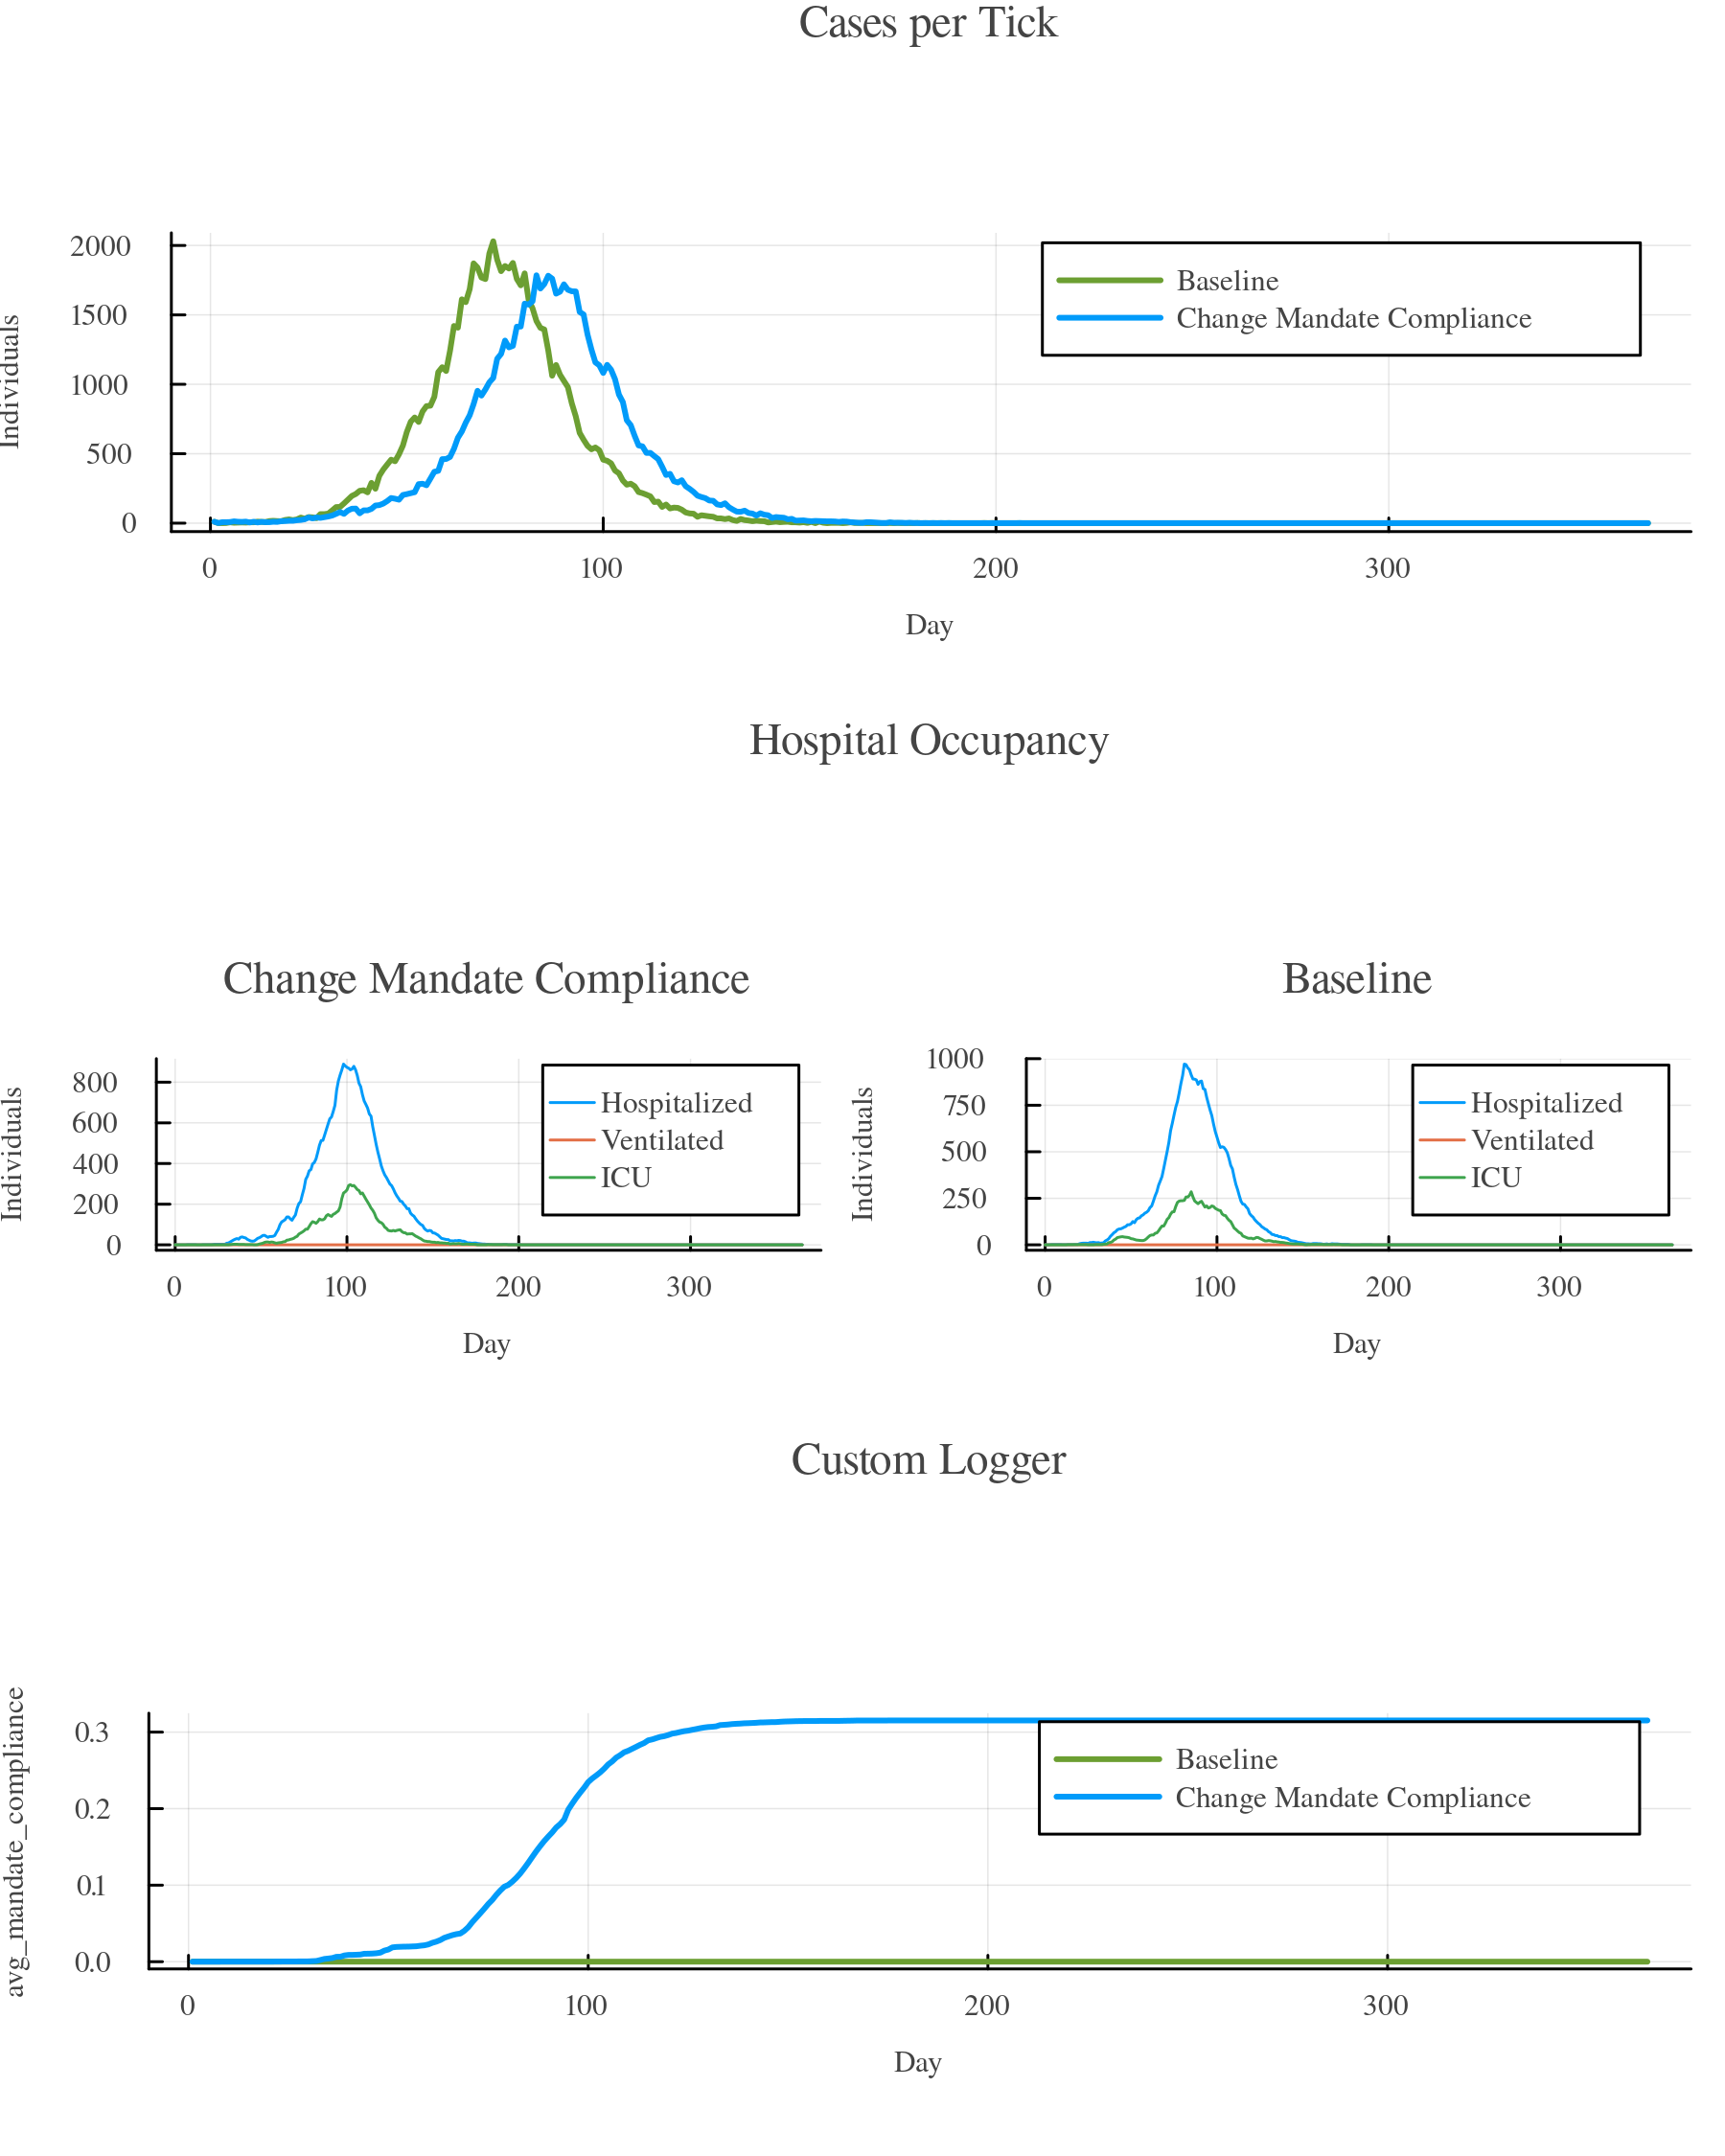
The results show how compliance evolves over time and how this shift in behavior influences overall case numbers and hospital occupancy. As more individuals experience the effects of the disease within their social circles, compliance rises—ultimately helping to control the outbreak.
Decaying Mandate Adherence
This scenario explores how decreasing adherence to public health mandates can affect the course of an epidemic. Specifically, we model a situation where individuals become progressively less likely to follow intervention rules over time. Each agent in the simulation has a mandate_compliance attribute, which defaults to 0. This value can decrease down to -1, representing complete non-compliance. In this scenario, every individual's compliance decays by 2% of its current value each day via a stepmod function, simulating a slow behavioral shift away from following public health rules. To evaluate the impact of this decay, we introduce a 14-day self-isolation measure for symptomatic individuals and compare two simulations: one where compliance decays over time, and a baseline where all individuals fully comply throughout the simulation. This allows us to observe how weakening adherence undermines the effectiveness of the same intervention.
Scenario Summary
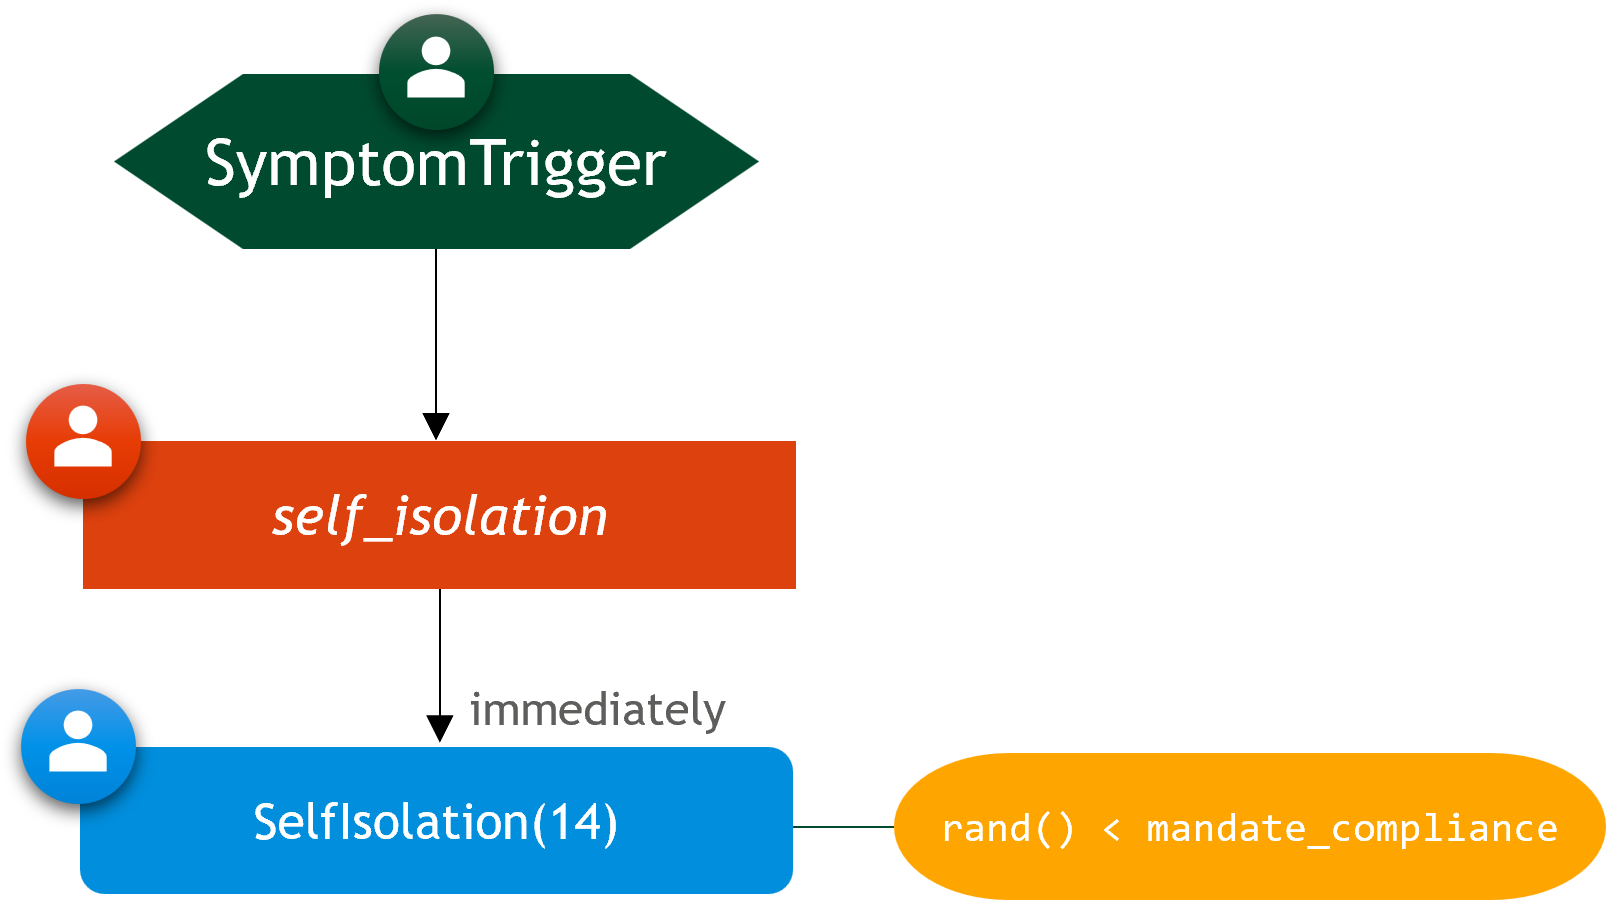
- Each individual's mandate compliance decreases by 2% daily via a
stepmod, simulating behavioral fatigue. - A 14-day self-isolation measure is applied to individuals who develop symptoms.
- The scenario is compared to a baseline in which all individuals fully comply with isolation rules throughout the epidemic.
using GEMS

# define a function that adds the isolation strategy to a simulation
# so we can re-use it for both scenarios
function initialize_experiment!(sim::Simulation)
    # make every individual 100% compliant in the beginning
    mandate_compliance!.(individuals(sim), 1.0)
    # add isolation scenario
    self_isolation_scenario = IStrategy("Self Isolation", sim)
    add_measure!(self_isolation_scenario, SelfIsolation(14),
    condition = i -> rand() < mandate_compliance(i))
    trigger = SymptomTrigger(self_isolation_scenario)
    add_symptom_trigger!(sim, trigger)

end

# define a function that reduces the mandate_compliance of every individual
function decaying_mandate_compliance!(sim::Simulation)
    for ind in individuals(sim)
        current  = mandate_compliance(ind)
        updated  = 0.98 * current
        mandate_compliance!(ind, updated)
    end
end

baseline = Simulation(label = "Self Isolation")
scenario = Simulation(label = "Decaying Mandate Adherence",
    stepmod = decaying_mandate_compliance!)

initialize_experiment!(baseline)
initialize_experiment!(scenario)

# custom logger
function avg_compliance(sim)
    inds = individuals(sim)
    return 100 * sum(mandate_compliance.(inds)) / length(inds)
end

cl = CustomLogger(avg_mandate_compliance = avg_compliance)
cl2 = CustomLogger(avg_mandate_compliance = avg_compliance)
customlogger!(scenario, cl)
customlogger!(baseline, cl2)

run!(baseline)
run!(scenario)

rd_b = ResultData(baseline)
rd_s = ResultData(scenario)

gemsplot([rd_b, rd_s], type = (:TickCases, :CumulativeIsolations, :CustomLoggerPlot),
 legend = :topright)
Plot
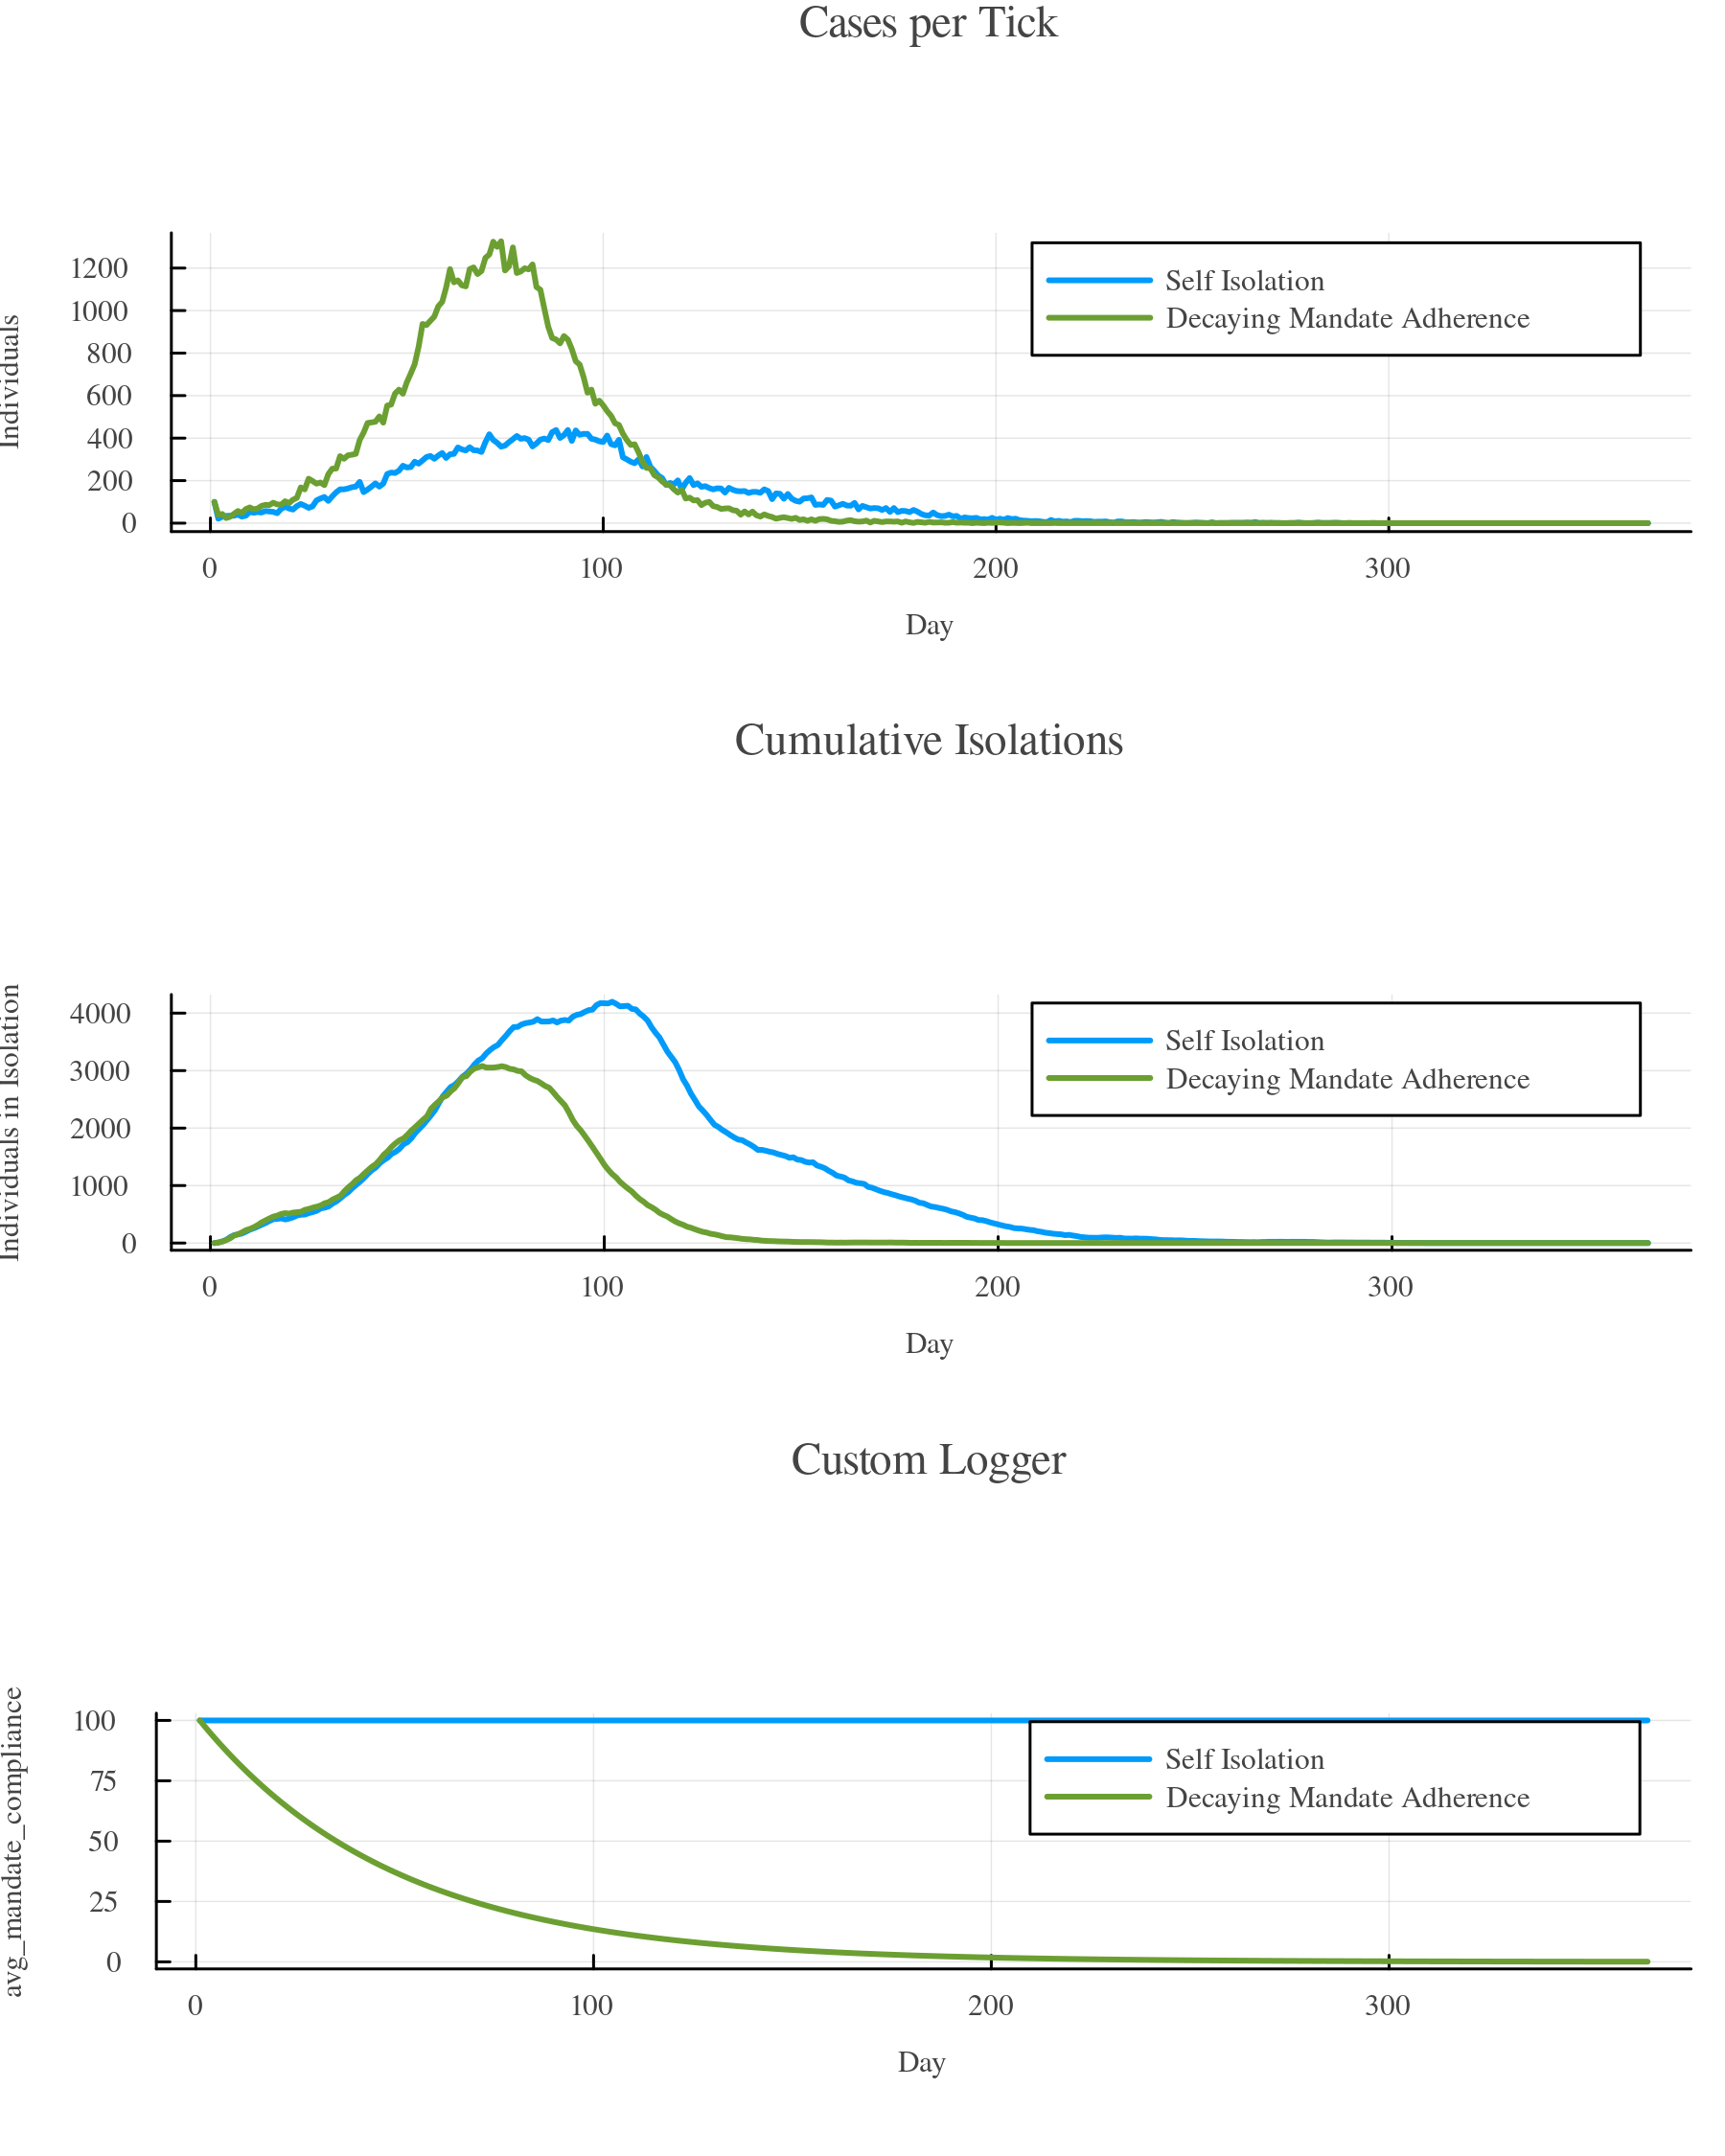
The results show that decaying mandate adherence significantly reduces the effectiveness of self-isolation. In the baseline simulation, where all individuals fully comply, the epidemic curve is flatter and isolation levels remain high throughout the peak period. In contrast, the scenario with decaying compliance experiences a sharper, higher peak in daily cases and fewer cumulative isolations. The custom logger confirms that average compliance steadily declines to -1, demonstrating that behavioral fatigue can undermine even well-designed interventions.
Adapting Behavior
Tutorial coming soon ...